Bitcoin [BTC/USD] Technical Analysis: Bear struggles to pull the market further down to break sideways movement
![Bitcoin [BTC/USD] Technical Analysis: Bear struggles to pull the market further down to break sideways movement](https://coinhub.news/img/d0/d0908bfdceb660f90d0341f27a0c8e15_730_522.webp)
The cryptocurrency market seems to be bored with the trend going consistently horizontal without fluctuating much. However, most of the top-10 coins are in a red-zone at present.
At the time of writing, Bitcoin was down by 0.35%, trading at $6,486 with a market cap of $112.4 billion. Its 24-hour trading volume was recorded at $3.5 billion.
1-hour:
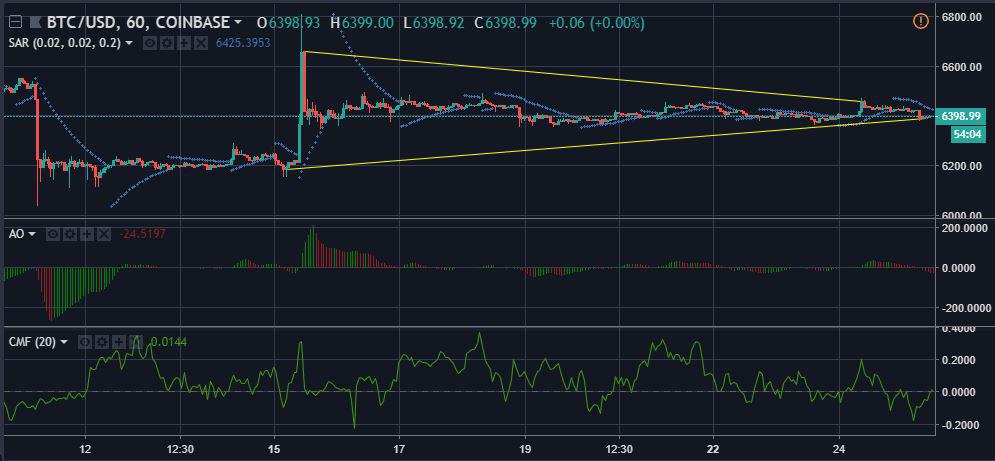
Over the past two weeks, the price trend for Bitcoin has become exponentially stable as demonstrated by the two trend lines from $6,658 to $6,457 [downward] and $6,182 to $6,388 [upward]. However, there is still no severe possibility of a trend breakout as the lines do not seem likely to converge soon.
The Parabolic SAR does not look optimistic on the BTC as of now. The dots are evidently against a bullish market trend and have displayed the same by aligning themselves above the candlesticks.
The Awesome Oscillator has a clear bearish stance on the Bitcoin price trend. The indicator is flashing a red sign, warning the community of a slowing market trend.
Meanwhile, the Chaikin Money Flow indicator has prepared a bullish case for the king-coin. After crashing hard on the ground, Chaikin Money Flow is shooting up, crossing the 0-mark to take the bull’s side.
1-day:
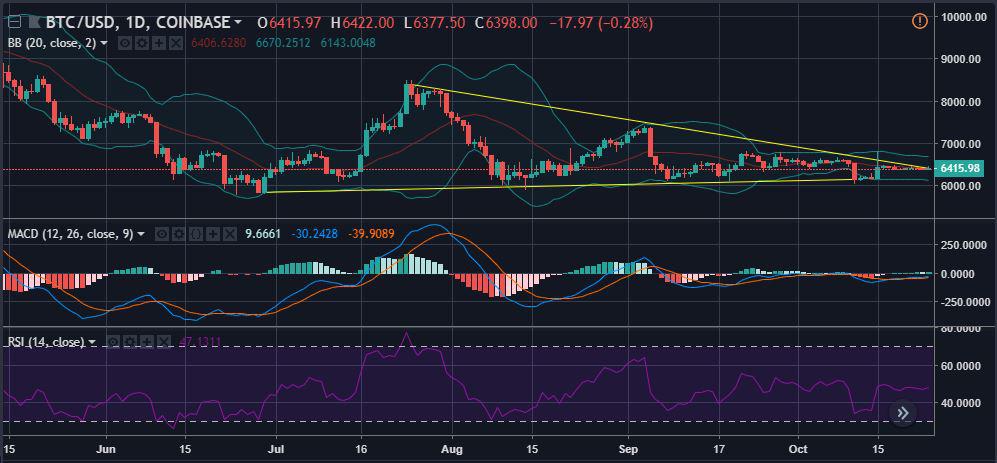
In a longer time-period, the Bitcoin price candles are showing a similar sideways approach on the charts. The downward trend line from $8392 to $6417 and the upward trend line from $5846 to $6155.
The Bollinger Bands are forming a tunnel-like pattern after following a narrow path. The indicator is indicative of a stable price trend as there are no signs of volatility in the market.
The MACD has a neutral approach to the market and is predicting a sideways trend for BTC. However, the indicator just a made a minor bullish crossover to lean more on the side of the bull.
The RSI is pointing straight, refusing to pay a prediction to the cryptocurrency. The indicator is more into the bearish zone at present.
Conclusion:
Most of the indicators used in the technical analysis have predicted a bearish-sideways trend with mixed opinion on a bullish or a bearish market.


Article comments