Bitcoin [BTC/USD] Technical Analysis: Prices stuck in a sideways pattern with no way out
![Bitcoin [BTC/USD] Technical Analysis: Prices stuck in a sideways pattern with no way out](https://coinhub.news/img/55/55e71a31d8fccf2e433abe437c08ee1a_730_522.webp)
Bitcoin prices are steadily bouncing between the immediate resistance and support lines trying to find a way out. The prices are currently trading at $3,824 with a market cap of $67.4 billion. The 24-hour trading volume shows $5.11 billion, of which the most volume is contributed by BitMEX via trading pairs BTC/USD.
1 Hour
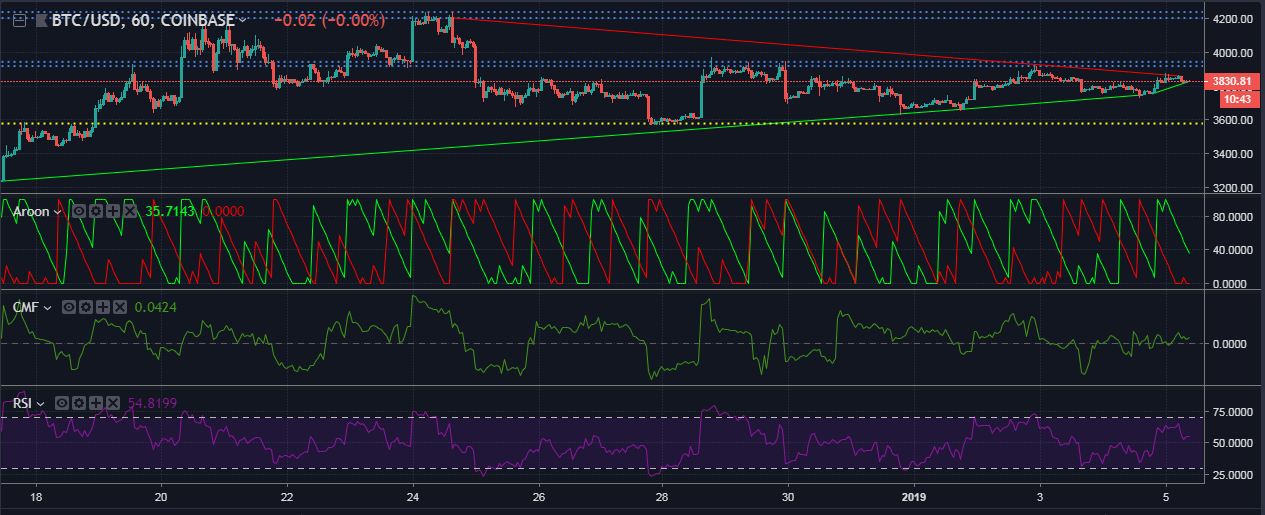
The one-hour chart for Bitcoin shows prices varying between the imminent supports and resistance points in a sideways fashion. The uptrend extends from $3238 to $3822, while the downtrend spans from $4205 to $3859. The prices are being supported by immediate support at $3577 and the immediate resistance that ranges from $3919 to $3944. The subsequent resistance range for Bitcoin exists between $4203 and $4239.
The Aroon indicator shows a decline in the downtrend of a short-term rally for Bitcoin while the downtrend has exhausted completely.
The Chaikin Money Flow is hanging just above the zero-line indicating that the money flowing into the market is slightly more than the money flowing out of the market for Bitcoin.
The Relative Strength Index for Bitcoin shows a reduction in the buying momentum to an almost neutral position.
1 Day
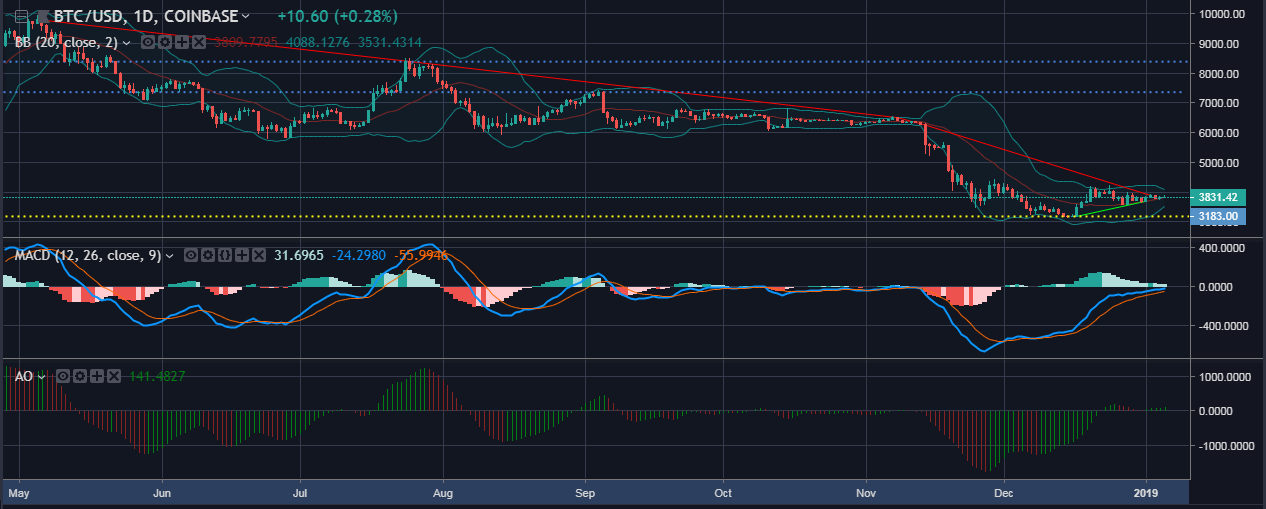
The uptrend for Bitcoin in the longer time-frame cannot be expected to be formed yet. The downtrend, however, can be seen hanging at $9800 to $4035. The prices are supported at $3183, with resistance lines present at $7359, $8385.
The Bollinger Bands in the one-day timeframe indicate that the BTC prices are undergoing a squeeze and the prices are holding steadily above the simple moving average.
The MACD indicator shows a bullish crossover that is underway from the bottom of the zero-line and a possible crossover to the top of the zero-line.
The Awesome Oscillator shows almost nil movement as the green spike is barely visible above the zero-line.
Conclusion
Bitcoin in the one-hour time frame is hanging in the middle, consolidating and moving sideways without any major rally to the upside or a slip to the downside as indicated by the Aroon, CMF and the RSI. The one-day chart shows a slightly bullish presence for Bitcoin as indicated by the MACD indicator, and the Bollinger Bands, but the AO indicates a stagnant motion for Bitcoin.


Article comments