Bitcoin Cash [BCH] Technical Analysis: Bullish market imminent, but bear has not let go completely
![Bitcoin Cash [BCH] Technical Analysis: Bullish market imminent, but bear has not let go completely](https://coinhub.news/img/9e/9e9fba99589c2cd49106d3e6b9142fa2_730_522.webp)
After the bear market engulfing the cryptocurrency market, bullish outbreaks are finally on the horizon. Bitcoin Cash [BCH], which has been struggling and falling on the CoinMarketCap list, stands on the eighth position, above Bitcoin SV [BSV].
According to CoinMarketCap, at the time of press, the coin was valued at $82.30, with a market cap of $1.4 billion. The eighth largest cryptocurrency registered a 24-hour trade volume of $82 million and had grown by 7.58% over 24 hours, after a steep fall of 25.04% over the week. At the time of reporting, the coin was keeping its growth intact at 0.64% over the hour.
1-hour
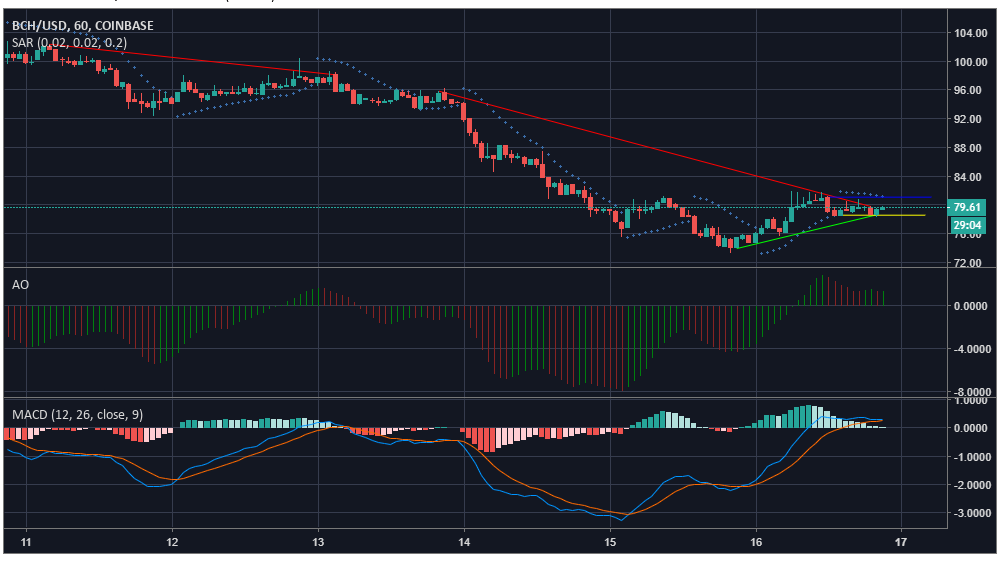
According to the one-hour chart, the coin registered a steep downfall from $102.33 to $98.08, which continued only further from $95.81 to $79.78. BCH also saw a miniscual uptrend from $73.92 to $78.61. The coin met with an immediate resistance at $81.07 and going with a strong support at $78.56.
Awesome Oscillator indicates that a bullish trend is gaining momentum.
MACD line is over the signal line marking a bullish market, however, it appears that the lines are about to undergo a crossover hinting a changing trend.
Parabolic SAR, on the other hand, is pointing towards a bearish market as the marker lines are above the candles.
1-day
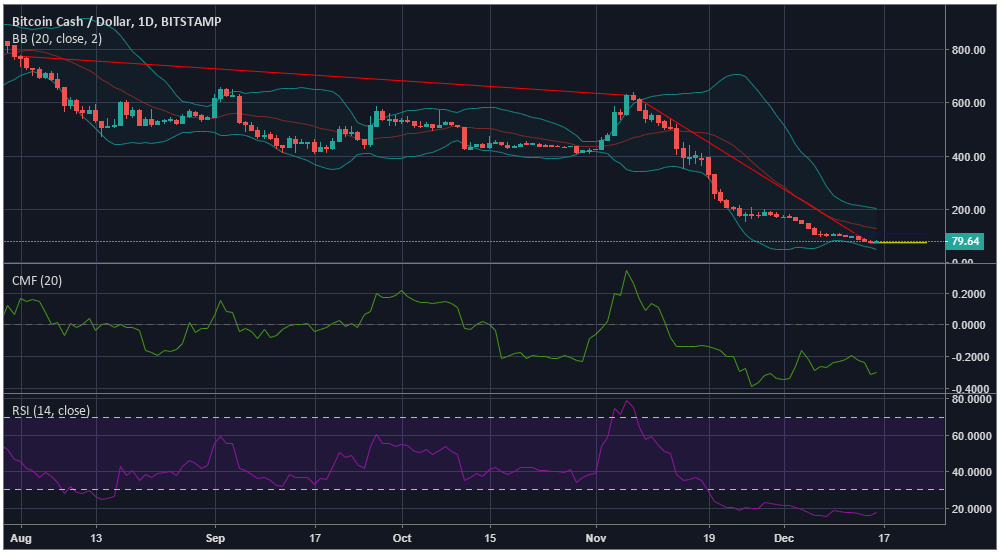
As per the one-day chart, the coin recorded a massive downtrend from $775.99 to $627.54, which continued to go as low as $86.68. The one-day chart did not point towards a significant uptrend in the chart. An immediate resistance was noticed by the coin at $107.85, while a strong support was observed at $79.64.
Bollinger Bands appear to be at a converging point, indicating less price volatility, however previous trends indicate a change in trend. The moving average line is above the candles, marking a bearish market.
Chaikin Money Flow also indicates a bearish market, as the marker line is below 0.
Relative Strength Index is in the oversold zone, pointing towards a bearish market.
Conclusion
As per the indicators Awesome Oscillator and MACD the market is bullish, whereas the one-day chart’s indicators, Bollinger bands, and CMF point towards a bearish market. This could be a momentary bullish trend, but only time will tell the fate of BCH.


Article comments