Bitcoin Cash [BCH/USD] Technical Analysis: Hopeful return of the bull post the bearish trauma
![Bitcoin Cash [BCH/USD] Technical Analysis: Hopeful return of the bull post the bearish trauma](https://coinhub.news/img/f0/f0fd2232c82e33661cf086b70a846328_730_522.webp)
Earlier today, the price of Bitcoin Cash [BCH] soared by 20% after the mining giant Bitmain announced the filing of its Initial Public Offering [IPO]. At press time, BCH is trading at $526.62 with a 24-hour price rise of close to 19%. However, it is yet to be analyzed whether the price will rally upward or follow the bear’s footsteps.
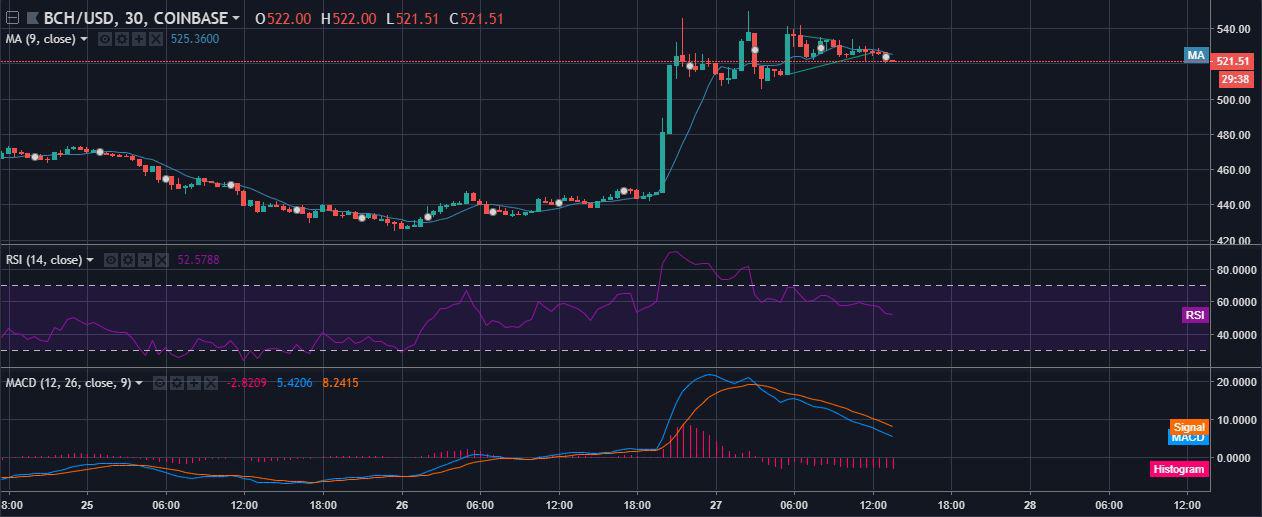
A bearish trend is visible on the 30-minute chart. The upward and downward trend lines ranging from $513 to $526 and $536 to $533 are apparent to form a triangle soon, interrupting the current trend.
The MA acted as a support but soon began resisting the price hike and is currently pointed in the falling direction.
The MACD is also in tune with the bearish trend displayed by the MA. Indulging in a bullish hangover, the MACD has made a bearish crossover at the signal. Currently, there are no signs of MACD resisting the downhill stroll.
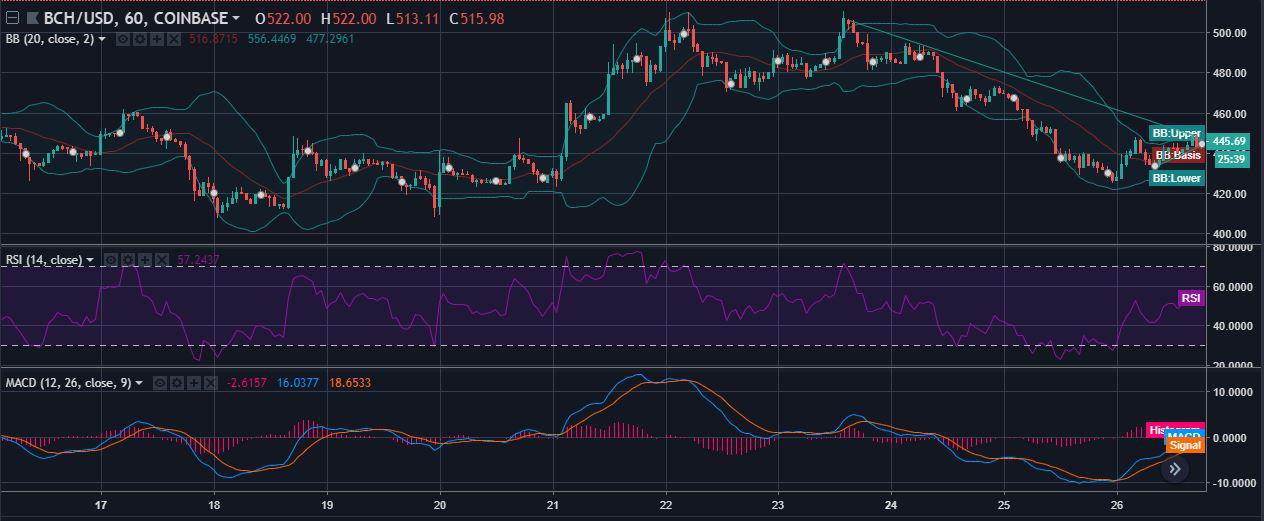
In the 1-hour trading view chart of BCH, the Bollinger band moved forward in a narrow path but soon showed massive divergence, forming a spoon. This shows the occurrence of volatility in the BCH market.
On the other hand, the RSI broke out into the overbought zone and started following a downward approach after a short period of resistance. Hence, it is also signaling towards a bearish run for the short term.
The MACD made a crossover to the bearish side of the signal in the 1-hour scenario as well. It is a clear sign that the price may move downhill in the future.
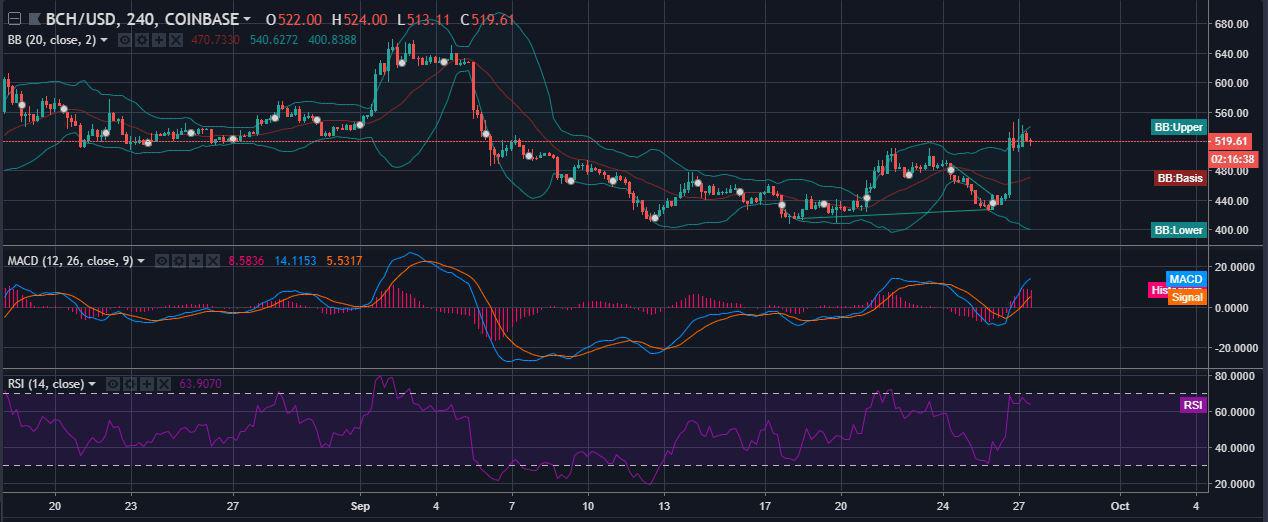
The candlesticks in the 4-hour timeframe are soon to experience a breakout in the price trend since the trend lines from $414 to $427 moving upward and $490 to $446 moving downward are about to intersect.
As per the movements showed by MACD, the signal is going against the majority indicators and appears to be bullish here. The histogram also agrees with the MACD and is giving similar indications.
Bollinger’s band in this scenario has widened after a bottleneck formation and is diverging further. This suggests an increasing volatile activity in the BCH market.
After the touching the oversell line, the RSI bounced back up and has been maintaining a resistance just beneath the overbought area. Currently, the RSI is observed to have taken a downturn, hence detecting a bearish presence.
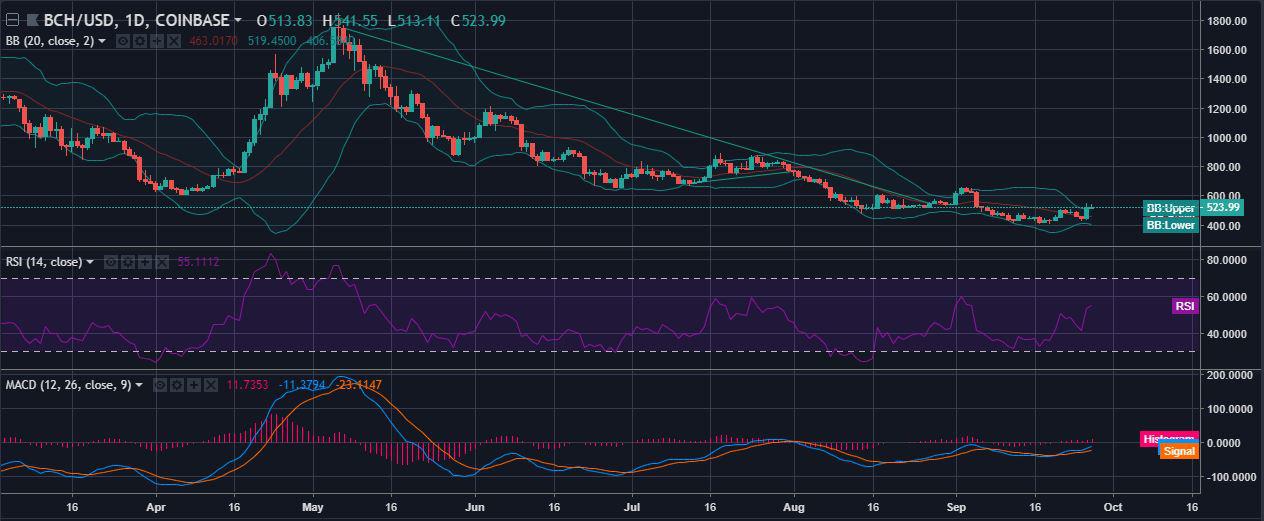
Bollinger band in the 1-day timeframe is showing a subtle increase in price volatility at the open bottleneck of its formation. This shows the instability in the buying and selling activity of the BCH in the market.
The RSI is showing a slight inclination to touch the oversell spot but has been moving up immediately after each downturn. Currently, the indicator is pointing towards a bullish trend.
The MACD showed two immediate crossovers. In the first signal cut, the MACD moved downward but soon got away from the bear claws and is riding the bull again.
Considering all the indicators into the market analysis, it is henceforth concluded that the BCH price may be falling off the bull soon. However, the long-term price trend of the coin is still flashing green and reflecting positivity. In the narrow timeframes, i.e., 1-hour and 4-hour, the prices are expected to slump whereas the indicators are suggesting strength in the prices in the longer timeframes.


Article comments