EOS/USD Technical Analysis: Support break indicates a bear run

The bear hold on the cryptocurrency market seems to have strengthened with altcoins taking most of its brunt. EOS which had earlier seen a 50 day high on 1st September had constantly dropped with the support at $5.54, till today.
30 minutes:

At the time of writing, EOS was trading at $5.386 with a total market cap of $4.919 billion. Today’s market was showing bullish signs with the trend lines indicating a sideways movement with the price of EOS slowly but surely dropping from today’s peak of $5.673. This prevailing trend was broken when the support at $5.540 gave way for EOS to drop further to its current price of $5.392.
The MACD [Moving Average Convergence Divergence] graph shows that the signal line and the MACD line have been dropping in tandem to indicate a bearish fate for the cryptocurrency. Both the signal line and the MACD line had converged at $5.662 after which the graph indicated the reversal of the sporadic bullish trend.
4 hours:
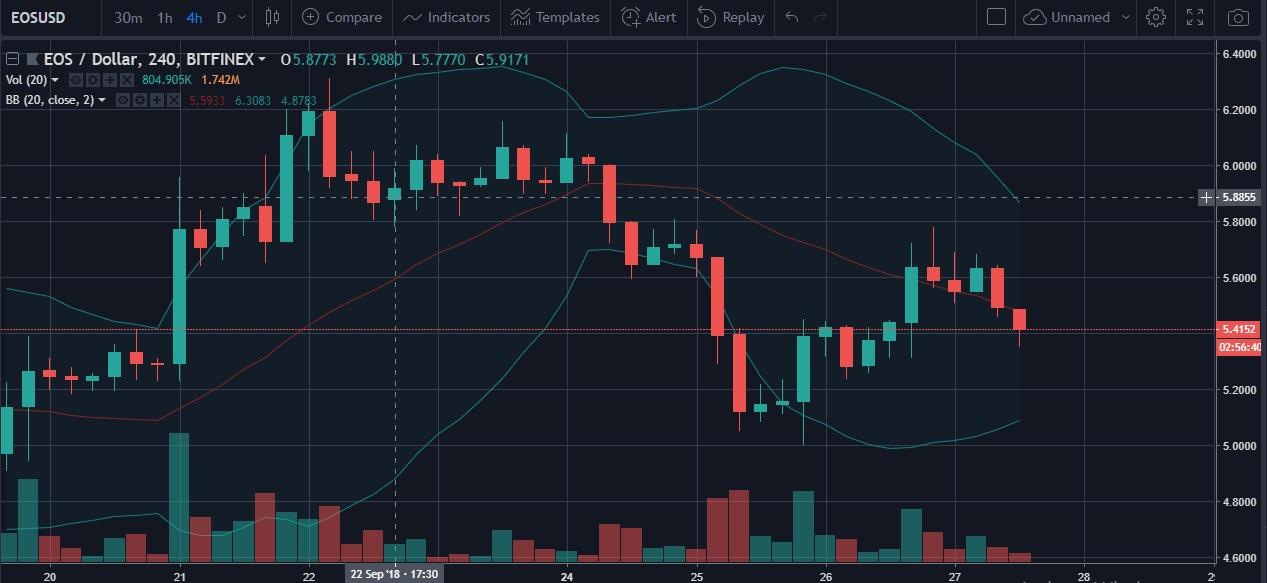
The Bollinger bands distinctly show a ‘venturi tube shape’ readout for the span of the previous week. At press time, both the standard deviation bands were converging towards each other, indicating a bearish hold. The entirety of the market movement was held within the Bollinger bubble, with the upper band at $5.864 and the lower band at $5.095. The only anomaly occurred when the support was broken for EOS to drop to $5.124 at the time.
1 day:
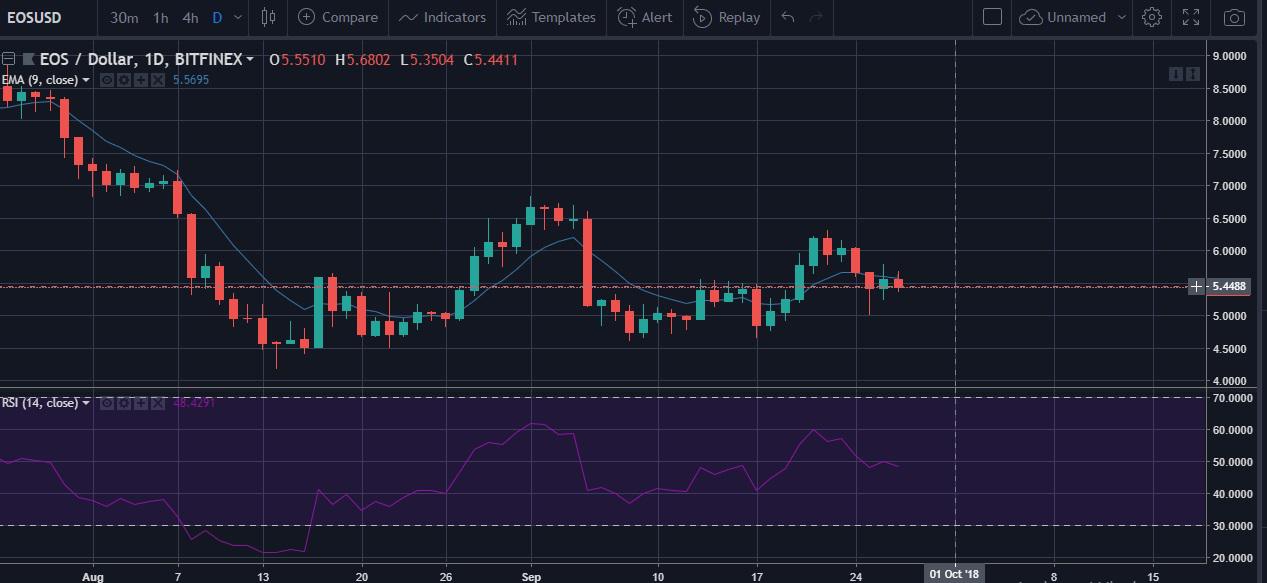
Looking at the Moving Average Exponential [EMA] patterns from August, the signal path shows a drastic slide into the bear’s clutches when the price of EOS dropped from $8.278. Only since the start of September has the EMA indicated an arrest of the slide, with the graph taking on the shape of a low amplitude cosine wave.
The Relative Strength Index [RSI] displayed irregular movement in the middle of August showing signs of massive oversell. September has seen more of a stable sideways movement with respect to the RSI, portraying EOS precariously balancing between the upper threshold and the lower threshold of the RSI graph.
Conclusion:
EOS’ current run seems to show an adjusted support which is holding at $5.384. The cryptocurrency also looks to be heading for a sustained lull with majority indicators pointing towards the reign of the bear.


Article comments