Ethereum [ETH/USD] Technical Analysis: Bear continues to haunt the coin
![Ethereum [ETH/USD] Technical Analysis: Bear continues to haunt the coin](https://coinhub.news/img/f4/f4bcc59fb1175ccdd889d1832717eb7c_730_522.webp)
Ethereum [ETH], the third-biggest cryptocurrency by market cap, sparkled green in the market for short duration earlier today. The coin was not the only one to shine, it was joined by Monero [XMR], Tron [TRX], and Bitcoin Cash. Nonetheless, the coin has returned to the bear’s realm after its short visit to bull’s house.
According to CoinMarketCap, at press time, Ethereum [ETH] is trading at $121.94 with a market cap of $12.6 billion. The cryptocurrency has a trading volume of $1.65 volume and has plunged by 29.99% in the past seven days.
One hour:
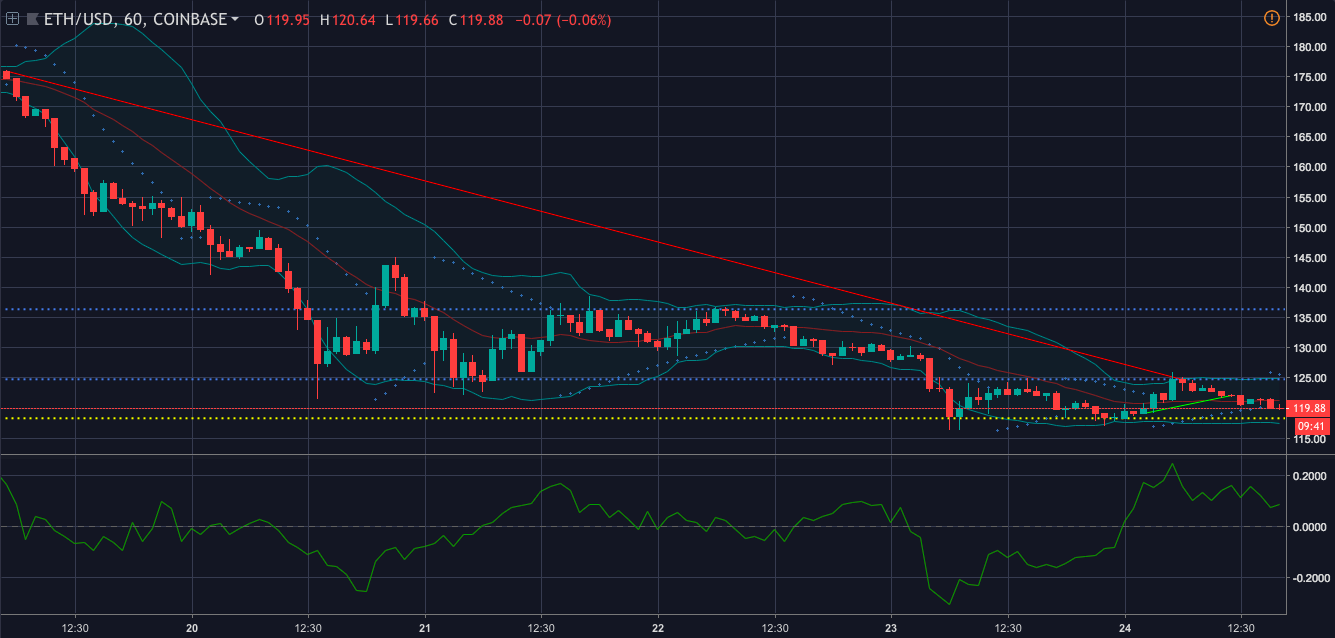
In the one-hour chart, Ethereum pictures a downtrend from $175.90 to $124.73. The coin demonstrates a short uptrend from $119.11 to $122.08. It has an immediate resistance at $124.78 and a strong resistance at $136.39. The chart shows that the coin has a strong support $118.31.
Parabolic SAR is currently depicting a bearish wave as the dots have started to align on top of the candlesticks, pushing the coin down.
Bollinger Bands indicates that the bands are contracting, forecasting a less volatile market for the coin.
Chaikin Money Flow shows that the money has started to flow into the market as the line is above the zero mark, indicating a bullish trend.
One day:
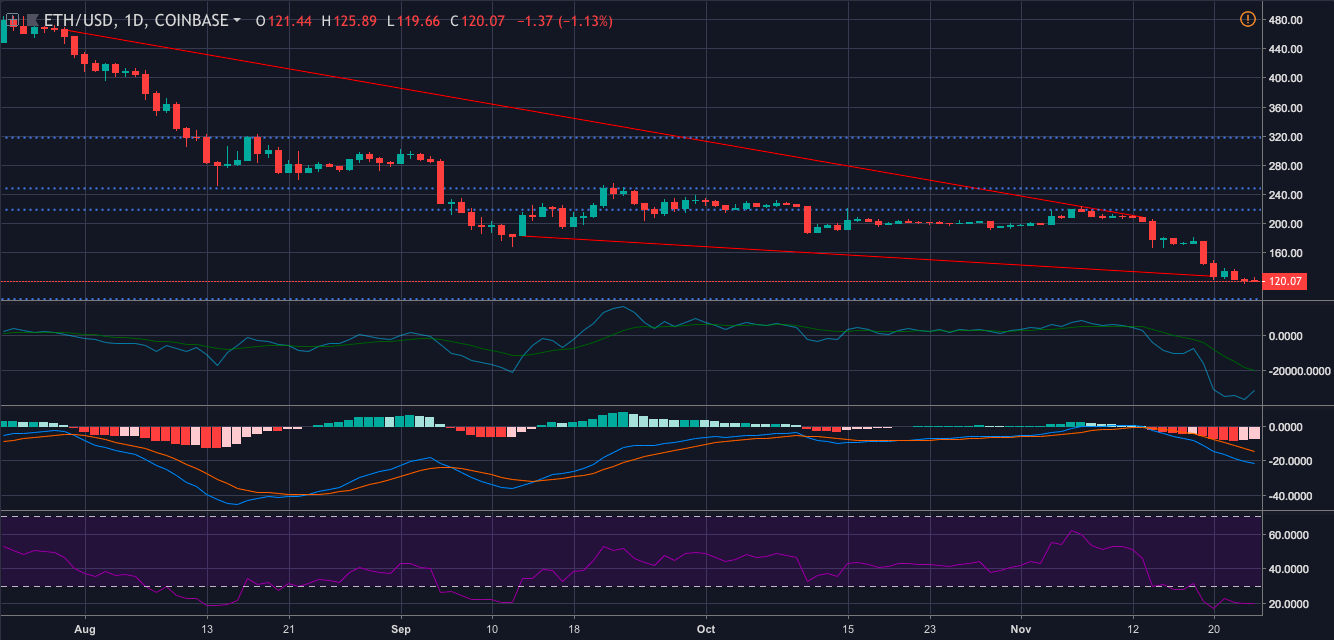
In the one-day chart, the cryptocurrency has a downtrend from $466.01 to $208.77. It also pictures a steep downtrend from $182.92 to $127.55. Ethereum does not demonstrate a significant uptrend. It has an immediate resistance point at $218.97, succeeding which the next point is at $248.27. The strong resistance is set at $317.96. The cryptocurrency has found its strong support at $96.19.
RSI is showing a bearish trend as the selling pressure for the coin is more than the buying pressure.
MACD is also on the bear’s side of the market as the moving average line has crossed over the signal line only to climb downhill.
Same applies with Klinger Oscillator as well. This is because the reading line is below the signal line, after it made a crossover.
Conclusion:
The cryptocurrency continues to be haunted by the bear, with its only escape option being Chaikin Money Flow from the one-hour chart. This is because the coin is held down by RSI, MACD, and Klinger Oscillator from the one-day chart and the Parabolic SAR from the one-hour chart.


Article comments