Ethereum [ETH/USD] Technical Analysis: Bear in control of market with onset of crypto-winter
![Ethereum [ETH/USD] Technical Analysis: Bear in control of market with onset of crypto-winter](https://coinhub.news/img/34/34cd6f5cbe8ec54d1f54130fc3afa205_730_522.webp)
Ethereum [ETH], which is now only the third-largest cryptocurrency in the world, is suffering collateral damage from the war between its fellow coins. The hash-war within the Bitcoin Cash [BCH] ecosystem due to the hard fork has proved to be uncontainable and is affecting the market negatively.
At press time, Ethereum was down by 2.1%, trading at a low price of $175.2, with a market cap of $18 billion. The total trading volume in the past 24 hours was observed at $1.9 billion.
1-hour:
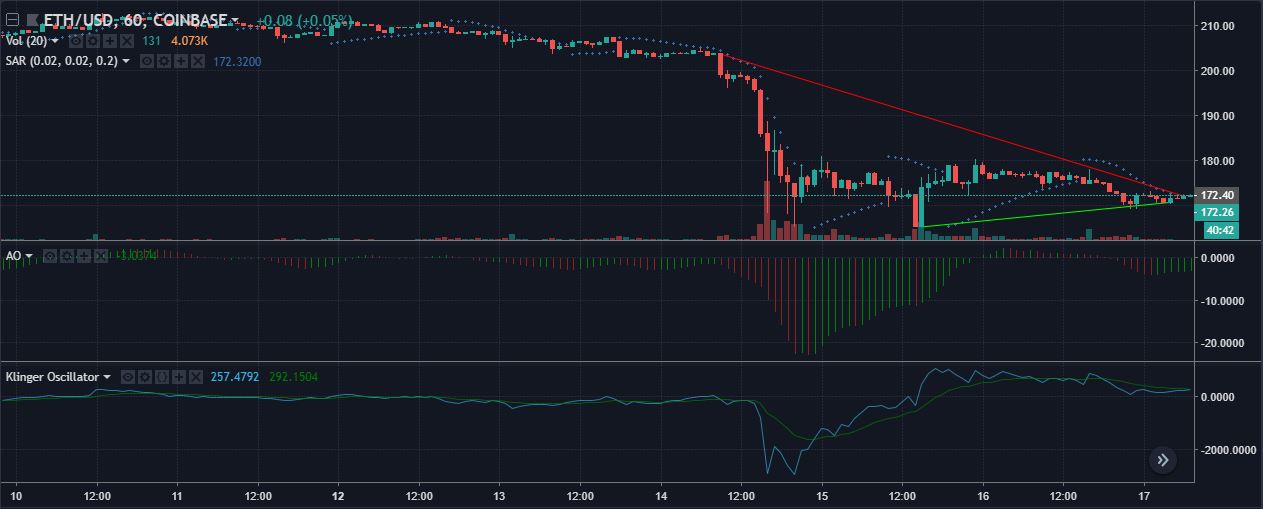
In the one-hour scenario, the downward trendline from $203.8 to $172.1 and the upward trendline from $165.6 to $170.3 might intersect in the upcoming market trend. Hence, it is safe to interpret that a trend breakout may take place soon.
The Parabolic SAR has just turned positive on the fate of the cryptocurrency as a single dot is placed below the candlesticks. It is likely that the indicator is siding with the bull.
The Awesome Oscillator is flashing a bullish sign as well. The bars are flowing green to project wealth for Ether.
The Klinger Oscillator made a steep bearish crossover by the signal. However, the reading line is approaching upward but still traveling below the signal.
1-day:
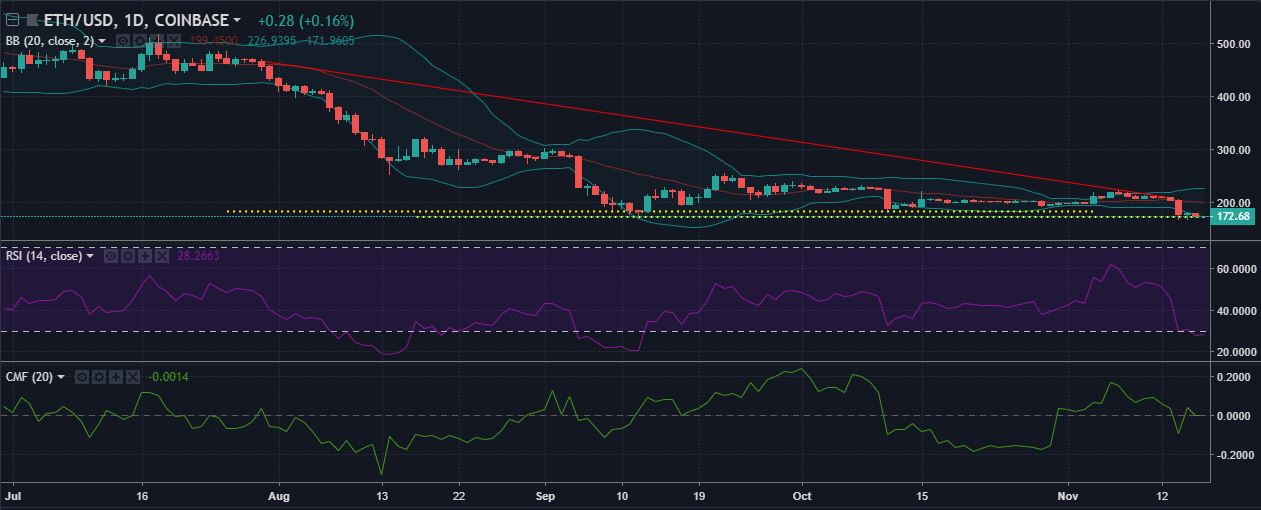
The one-day timeline for the Ether candlesticks shows that a downtrend is suspended from $466.1 to $208.6 with a support level set at $172, by breaking the previous support at $182. This is indicative of a fierce bear market for the token that has been getting worse.
The Bollinger Bands are depicting a lesser volatility in the ETH market as the bands have converged, which is not enough to facilitate wild price fluctuation.
The RSI has dunked to the oversold zone as of now. The indicator is highly bearish on the coin, although this may be a sign for price trend reversal.
The Chaikin Money Flow was bullish on Ethereum as well, but has now taken a downward approach. The reading line is about to cross the 0-line to enter the bear’s territory.
Conclusion
The technical analysis suggests that there will a prolonged bear market for Ethereum with occasional upturns. Furthermore, the cryptocurrency will also remain low on volatility to curb any chances of a severe breakdown.


Article comments