Ethereum [ETH/USD] Technical Analysis: Bear market looks to pull down token
![Ethereum [ETH/USD] Technical Analysis: Bear market looks to pull down token](https://coinhub.news/img/8b/8be87510719e4140f29bcb3dddd47f7a_730_522.webp)
Ethereum [ETH], the third-largest cryptocurrency, has stepped back into the game. The coin has taken charge with a 6.57% increase in the past 24 hours, successfully landing a hit on the bear.
According to CoinMarketCap, at press time, the cryptocurrency was trading at $122.33 with a market cap of $12.66 billion. The coin recorded a trading volume of $2.48 billion and has seen a rise of over 1% in the past one hour.
1-hour
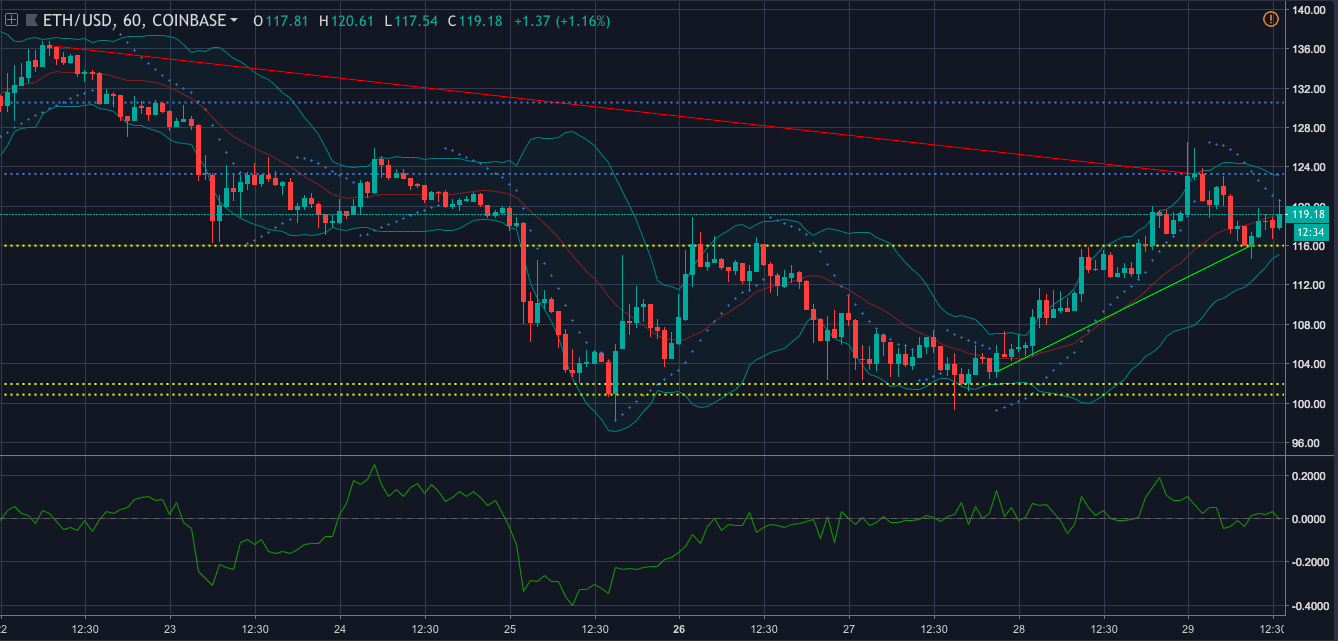
In the one-hour chart, the cryptocurrency pictures a downtrend from $136.31 to $123.26. The chart also demonstrates an uptrend from $103.19 to $116.03. The cryptocurrency has an immediate resistance at $123.27 and a strong resistance at $130.52. Its immediate support level is set at $116 and strong support at $100.87
Chaikin Money Flow is currently bullish for the coin as the line is above the zero line, indicating that the money is flowing into the market.
The Parabolic SAR, on the other hand, is bearish for the coin as the dots have aligned on top of the candlesticks.
Bollinger Bands are seen contracting, forecasting a less volatile market for the coin
1-day
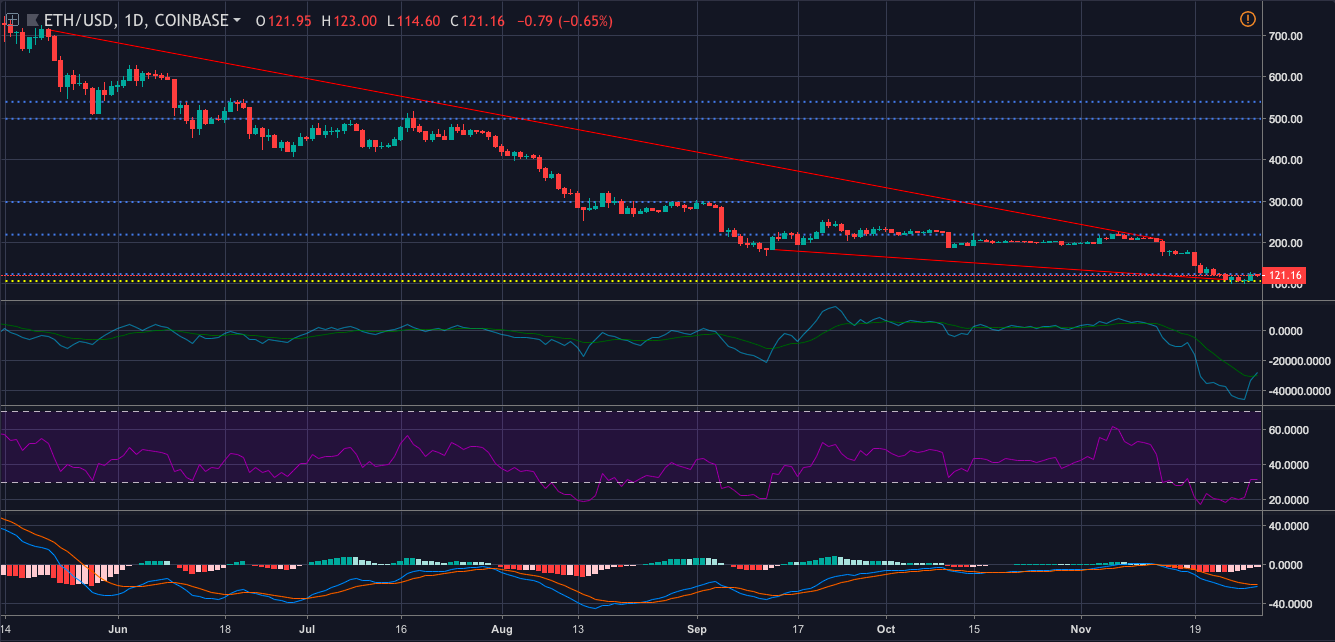
In the one-day chart, the coin pictures a downtrend from $714 to $206.20. It has also recorded another steep downtrend from $182.92 to $110.16. The coin has an immediate resistance at $123.68 and a strong resistance at $296.55. It also demonstrates that the coin has a support level at $106.63.
MACD is showing a bearish wave as the moving average line has made a crossover below the signal line.
Klinger Oscillator is on a different page as that of the MACD as the reading line has made a bullish crossover.
RSI is showing that the buying pressure and the selling pressure for the coin are currently evened out, though it seems that the bear’s grasp is strong.
Conclusion
The bull and the bear seem to have engaged in an intense fight, with the bull gaining the support of Klinger Oscillator from the one-day chart and the CMF from the one-hour chart. The bear has the support of MACD from the one-day chart and the Parabolic SAR from the one-hour chart.


Article comments