Ethereum [ETH/USD] Technical Analysis: Bull finally takes the lead
![Ethereum [ETH/USD] Technical Analysis: Bull finally takes the lead](https://coinhub.news/img/72/720006e45def61ca18ef4765b5182f4c_730_522.webp)
Ethereum [ETH], the third-largest cryptocurrency by market cap, continues to bleed red in the market. However, the cryptocurrency is sprinkled with green on a timely basis, showing signs of returning home.
According to CoinMarketCap, at press time, Ethereum was trading at $91.32, with a market cap of $9.47 billion. The coin shows a trading volume of $1.65 billion and has plunged by 17.33% in the past seven days.
1-hour
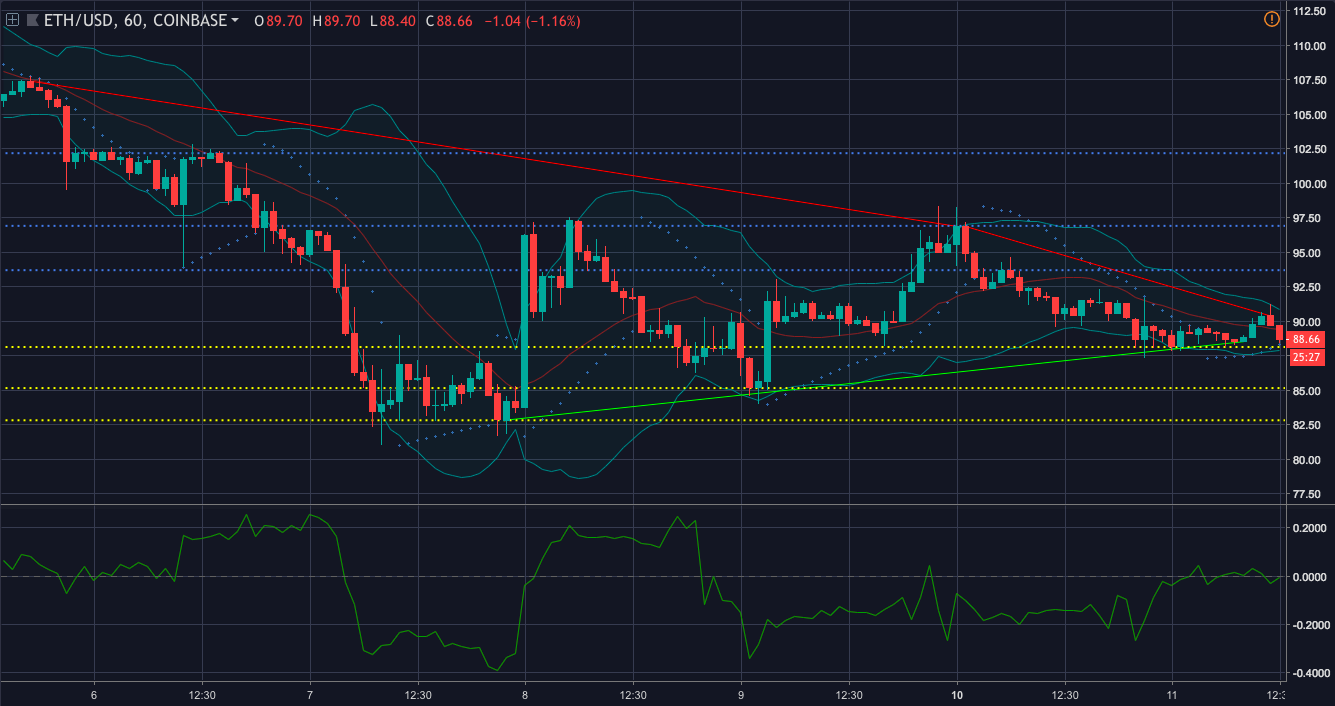
Parabolic SAR is showing a bullish wave as the dots have aligned below the candlesticks.
Bollinger Bands are predicting a less volatile market for the coin as the bands have started to reunite.
Chaikin Money Flow is demonstrating a bearish wave as the money is flowing out of the market, but are showing signs of recovery.
1-day
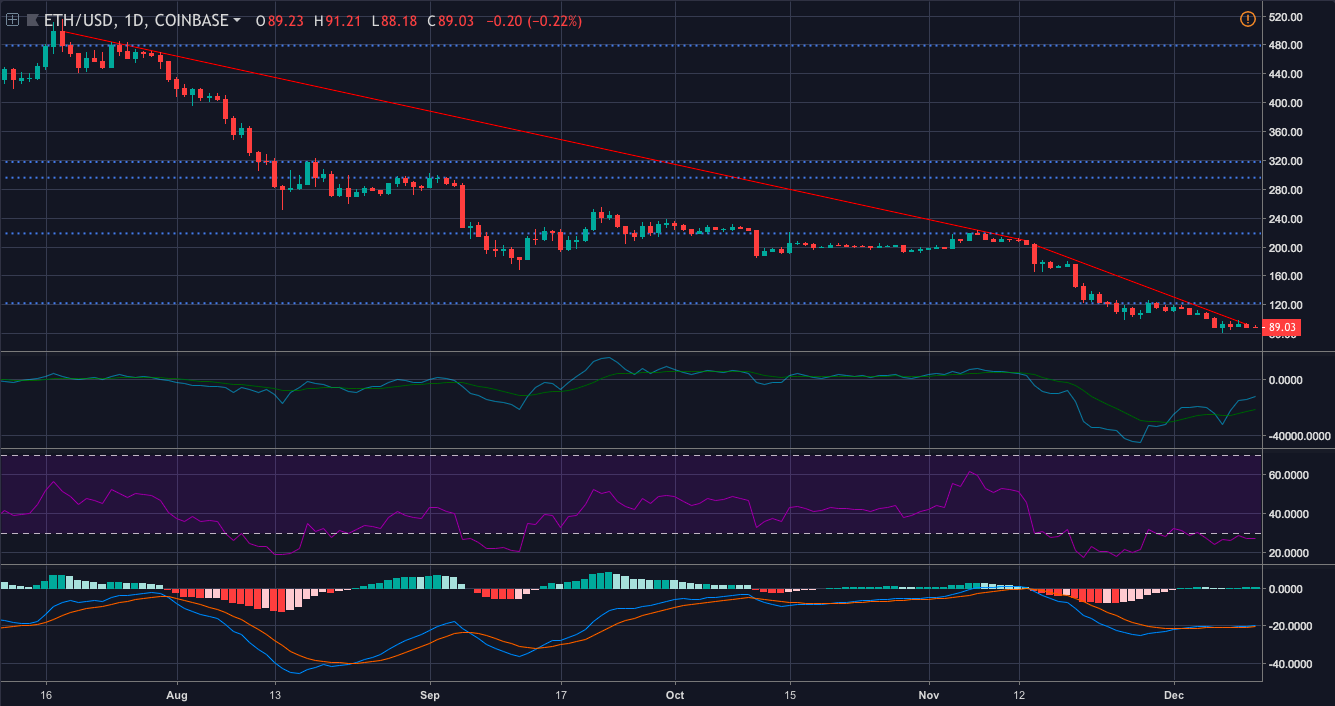
Klinger Oscillator shows that the reading line has made a bullish crossover.
MACD is also predicting a bullish trend as the moving average line has made a crossover only to take the upward direction.
RSI is picturing the coin being oversold in the market, forecasting a bullish trend.
Conclusion
MACD and Klinger Oscillator from the one-day chart, along with Parabolic SAR from the one-hour chart, is predicting a bull run. Whereas, RSI from the one-day chart and CMF from the one-hour chart, are forecasting a bearish wave.


Article comments