Ethereum [ETH/USD] Technical Analysis: Bulls to be an occasional visitor in bear’s kingdom
![Ethereum [ETH/USD] Technical Analysis: Bulls to be an occasional visitor in bear’s kingdom](https://coinhub.news/img/cd/cdfa8d3449aef2aba09074ad7e58652d_730_522.webp)
As Ethereum [ETH] becomes increasingly incapable of regaining its lost glory by surpassing XRP’s market cap, the coin’s price has been seeing a consistent dip as well. At press time, ETH was down by a massive 7.9%, trading at a low price of $133 with a market cap of $13.8 billion. The 24-hour trading volume was recorded at $3.2 billion.
1-hour
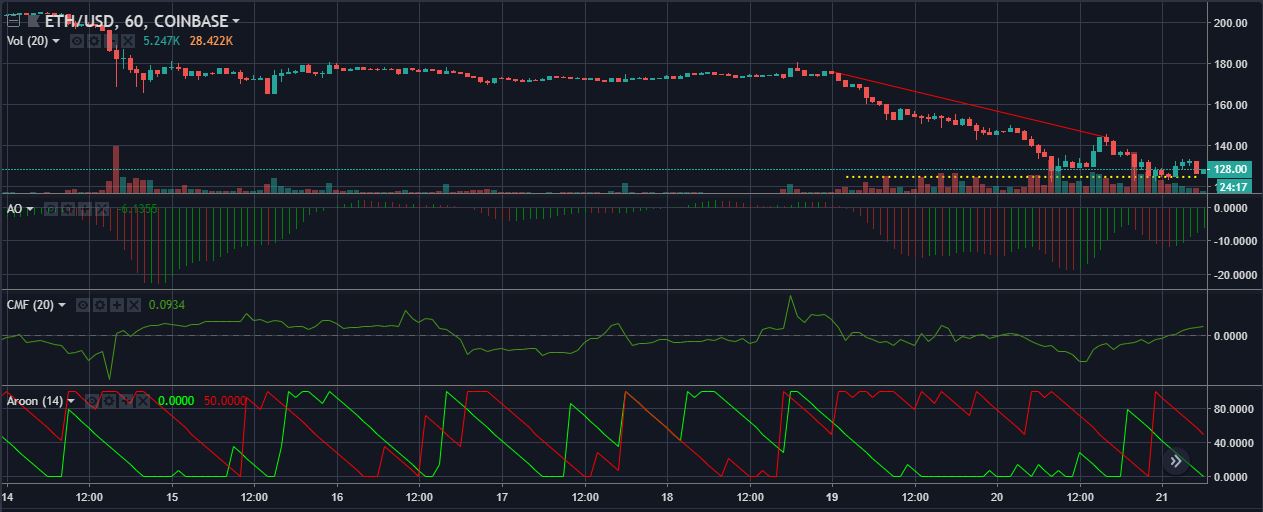
In the one-hour scenario, the downward trend line is stretching from $175.9 to $173.9, while a support level is set at $124.4. The downtrend is forming a descending triangle, with the support to project a decline in the ETH price. However, a trend breakout may be a far-off possibility in this case.
The Awesome Oscillator is glowing green to predict an upliftment in the current bearish trend. The bars have sided with the bull and ditched the bear.
The Chaikin Money Flow is also bullish on the prediction of Ether candlesticks. The reading line has crossed the 0-line and is still moving upwards.
The Aroon Indicator is displaying a weakened downtrend but is still bearish on the matter as the downtrend is relatively stronger than the uptrend.
1-day
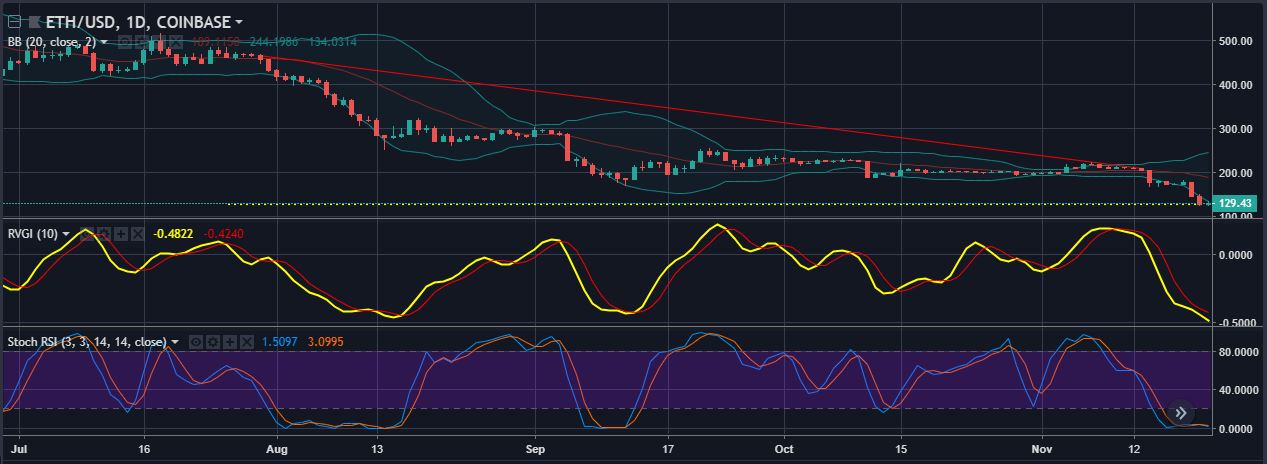
In the one-day ETH candlesticks, the downtrend is moving from $465.9 to $209 point, while the support line is fixed at $127.5. A descending triangle can be observed again but there are so signs of a trend breakout.
The Bollinger Bands are moving apart from each other to give way to showcase increased volatility.
The Relative Vigor Index has made a bearish crossover by the signal. The RVGI is approaching further down to crash the bear’s party.
The Stochastic RSI is in the oversold zone, entwined with the signal line to blur its stance. However, a trend reversal is expected as the selling activity pulls down the market low enough for the buyers to react.
Conclusion
In the technical analysis, it is evident that the indicators used in the short-term timeline are suggestive of a bullish trend for the cryptocurrency. However, in the longer scenario, the indicators are predicting that the bear market for ETH has not ended.


Article comments