Litecoin [LTC/USD] Technical Analysis: Cryptocurrency to move along with the bulls on a long run
![Litecoin [LTC/USD] Technical Analysis: Cryptocurrency to move along with the bulls on a long run](https://coinhub.news/img/fe/fe2a11d9ad546a2dc10b9db42d38b605_730_522.webp)
The cryptocurrency market seems to have recovered from the bearish hit after Bitcoin [BTC] crossed the $4,000 mark this Sunday. Most of the digital assets have shown a significant surge in the past week. Litecoin [LTC] is one of the top gainers for the week with a massive 31.5% hike.
At press time, LTC is trading at $40.53, with a market cap of $2.4 billion. The cryptocurrency is currently at the sixth spot in the market list right below EOS. It has also shown 6.2% hike in the daily statistics. About 10% of the trading volume is seen to be on an exchange named Bit-Z for LTC/BTC trading pair.
1-hour
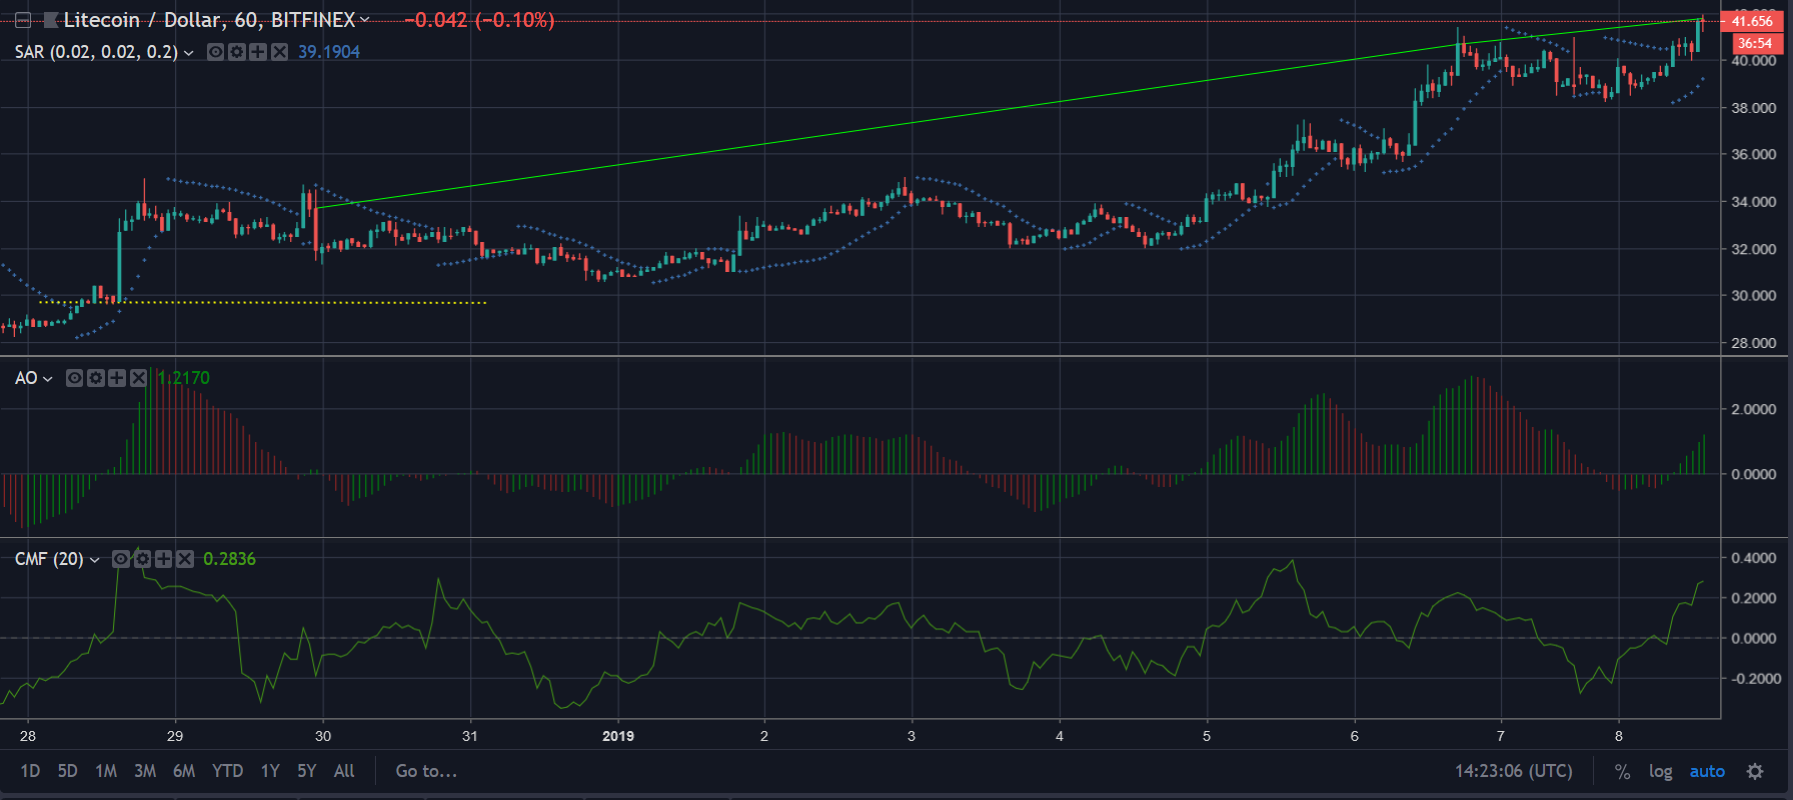
The hourly chart of LTC is showing a significant uptrend ranging between $33.62 – $40.65 – $41.76, with a support point set at $29.63.
The Parabolic SAR has been depicting a fusion of upward and downward trend from the time LTC was on its sideways movement. However, the indicator is currently forming the dots below the candlesticks showing a bullish trend.
The Awesome Oscillator is demonstrating a bullish trend for LTC as the green spikes are picking up the momentum right now.
Chaikin Money Flow is moving upwards indicating that there is a strong inflow of money in the LTC market compared to yesterday’s market scenario.
1-day
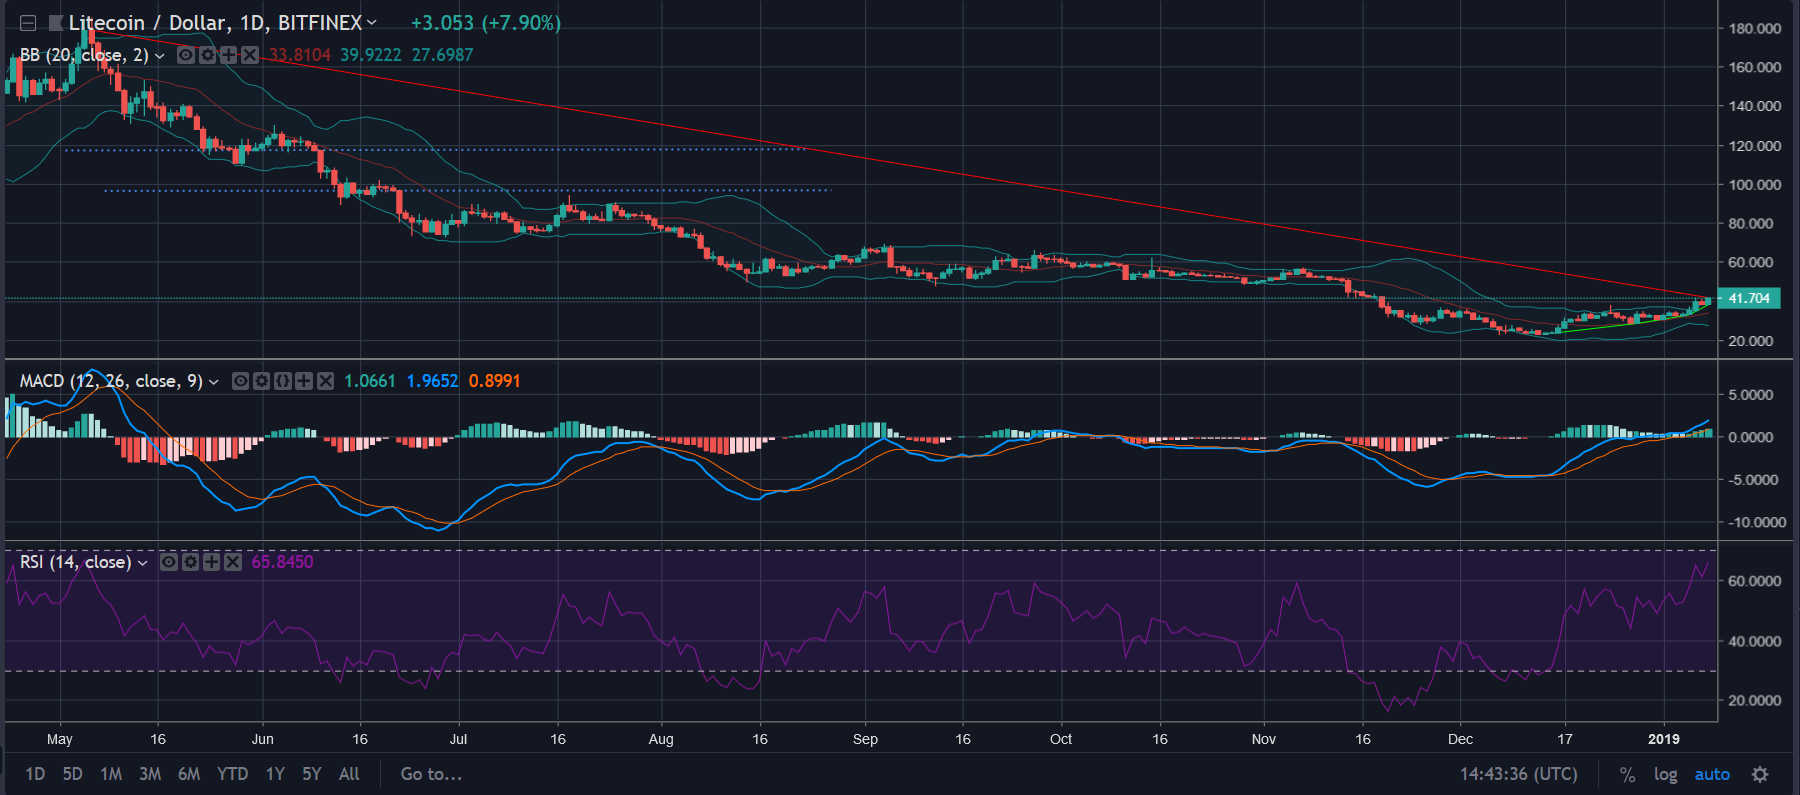
The daily chart of Litecoin [LTC] shows a downtrend extending from $176.76 – $40.2 and an uptrend from $24.03 – $28.03 – $38.05. Also, the resistance is formed at $96.28 and $117.8.
The Bollinger Bands is depicting a bullish momentum for the cryptocurrency as the candlesticks are forming above the moving average line.
The MACD has taken a bullish crossover wherein, both moving average and signal line is moving upwards.
The Relative Strength Index shows that the buying pressure is higher than the selling pressure in this timeframe as the indicator is moving towards the overbought zone.
Conclusion
All the indicators are demonstrating a strong bullish trend, in the case of Litecoin. However, the diverging Bollinger Bands indicate that there are chances of slight volatility in the market.


Article comments