XRP’s momentum slows down as bears take a bite at the digital asset

1-Hour XRP
In the 1-hour chart, XRP faced resistance at $0.264 in addition to getting support at $0.250. The digital asset saw an uptrend from $0.262 to $0.265. XRP also underwent two sharp downtrends. The first downtrend from $0.264 to $0.261 an the second uptrend started from $0.262 and ended at $0.253.
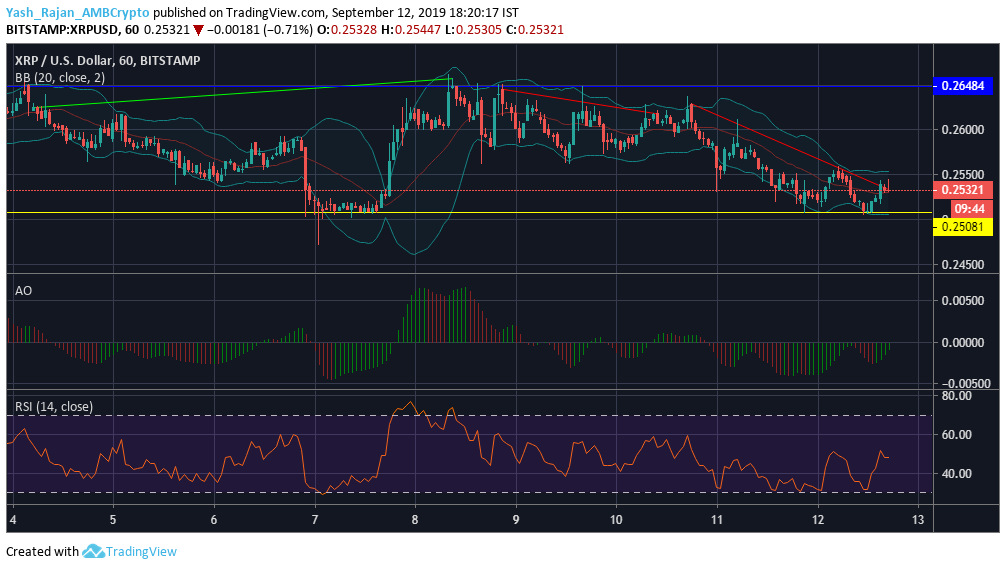
Bollinger Bands were squeezing, displaying that volatility reduced in the market.
Awesome Oscillator presented a bearish trend in the market as the long-term momentum was greater than the short-term momentum. The green lines appearing at the end indicated the possibility of a bullish market latterly.
The RSI indicator stood at 48.12, exhibiting that selling pressure was high.
1-Day XRP
In the one-day chart, XRP formed support at $0.250. The digital asset faced resistance at $0.475. XRP recorded a sharp downtrend from $0.473 to $0.255. Previously, Ripple’s token recorded an uptrend from $0.328 to $0.458.
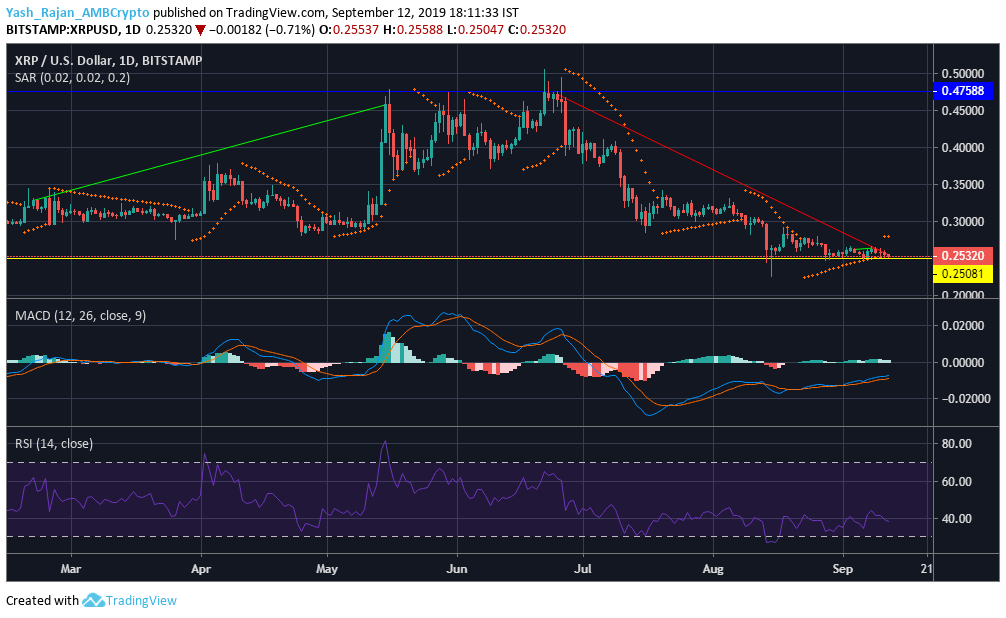
Parabolic SAR conveyed a bearish trend as the dotted markers were present above the candles.
The MACD line crossed above the signal line, revealing a bullish trend with a slight chance of reversal.
The RSI indicator stood at 37.10, displaying that selling pressure was high.
Conclusion


Article comments