Bitcoin Price Analysis Jan.10: BTC Breaks Down to $3800 Following a Long Squeeze

When you don’t break up, you lose momentum, then quickly lose stability and break down. As we all know, Bitcoin is a volatile asset. Maybe the most volatile around.
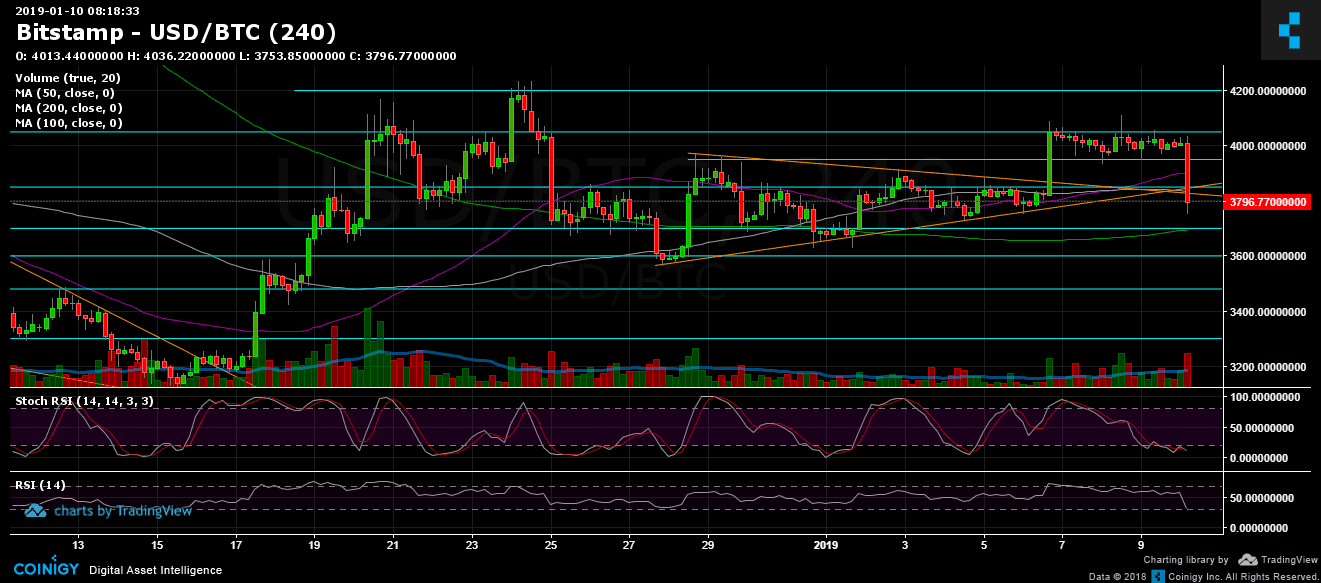
Over the past days, Bitcoin was trying to breach the $4050 major resistance mark. The buyers became weaker and weaker till they lost in the battle and we’ve just seen an ugly red candle back down to the $3800 area.
If this reminds of some pattern, it must be the so-called Bart Simpson’s head. Another “Bart” to the collection.
A point worth mention is the amount of open short positions. We’ve pointed out here that the shorts are nearing their lowest point since the middle of November last year. As we said here before when shorts are at their bottom expect a long squeeze. When shorts are near their top, expect a short squeeze. Simple as that.
The shorts reached their closest point (22K) to the low of November 14 (19.5K). We all remember that horrible day, the last day we’ve seen Bitcoin above $6000.
Looking at the 1-day & 4-hour charts
BTC/USD BitStamp 4-Hour chart
BTC/USD BitStamp 1-Day chart


Article comments