Bitcoin Price Analysis Oct.7: A possible move ahead?
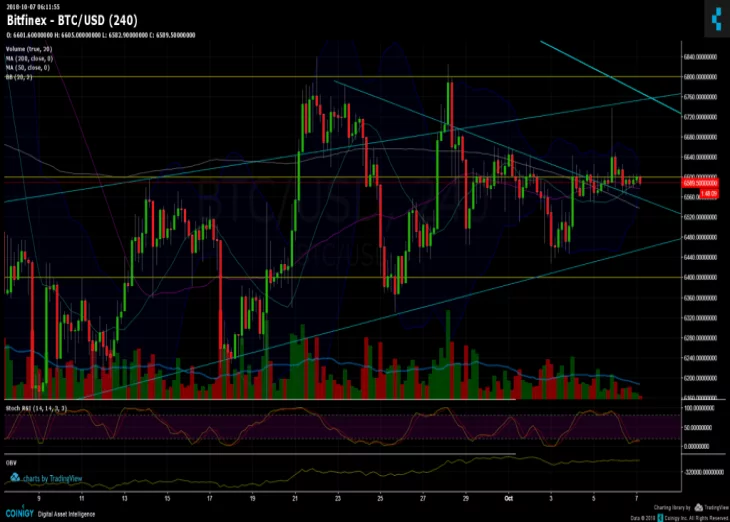
The long-term consolidation of Bitcoin from the past weeks is coming to an end soon? Two significant signs indicate on a coming up movement: Bollinger bands are very tight, along with 200 and 50 days moving average lines that have recently crossed each other.
Over the weekend Bitcoin had re-tested the upper line of the “channel” reaching a high of $6740, but didn’t have enough buying power to stay there.
Now what?
Bitcoin Prices: BTC/USD BitFinex 4 Hours chart
Cryptocurrency charts by TradingView. Technical analysis tools by Coinigy.


Support this Site


Article comments