Ethereum Price Analysis Jan.11: Following Bitcoin, ETH Reached Major Support at $124

BTC price couldn’t find the needed momentum for another leg up, and the bears took advantage of the situation and slammed the price of BTC down by 6.5%. The big Altcoins followed as well with a significant downward vertical move that took their price down by 15-20%.
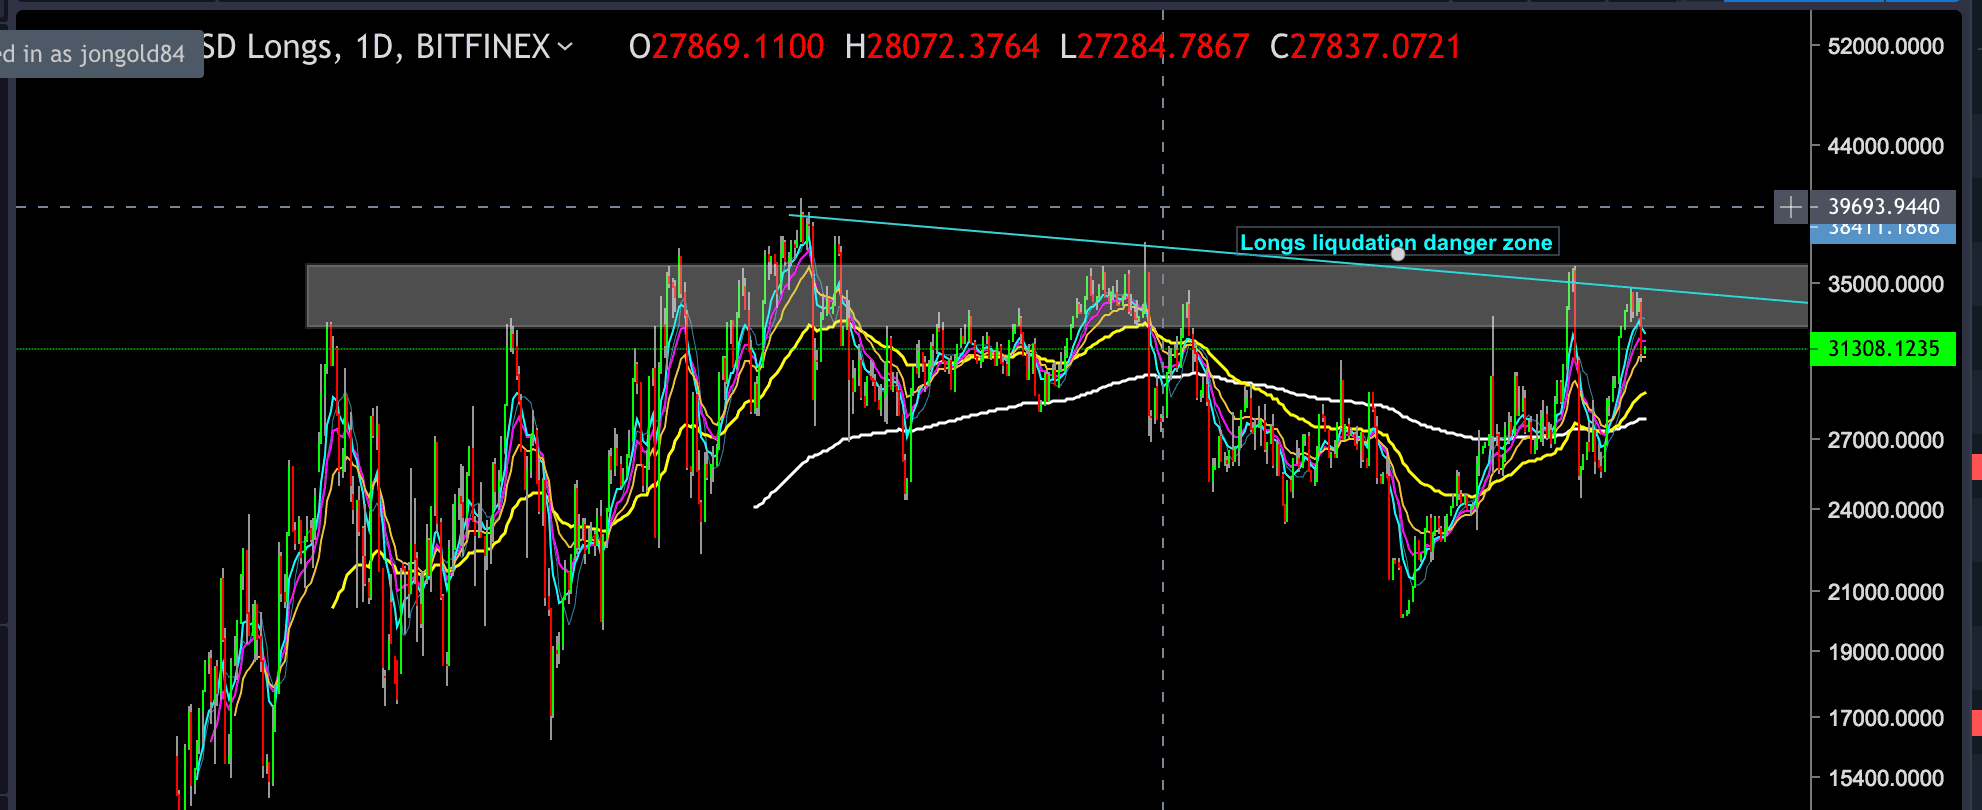
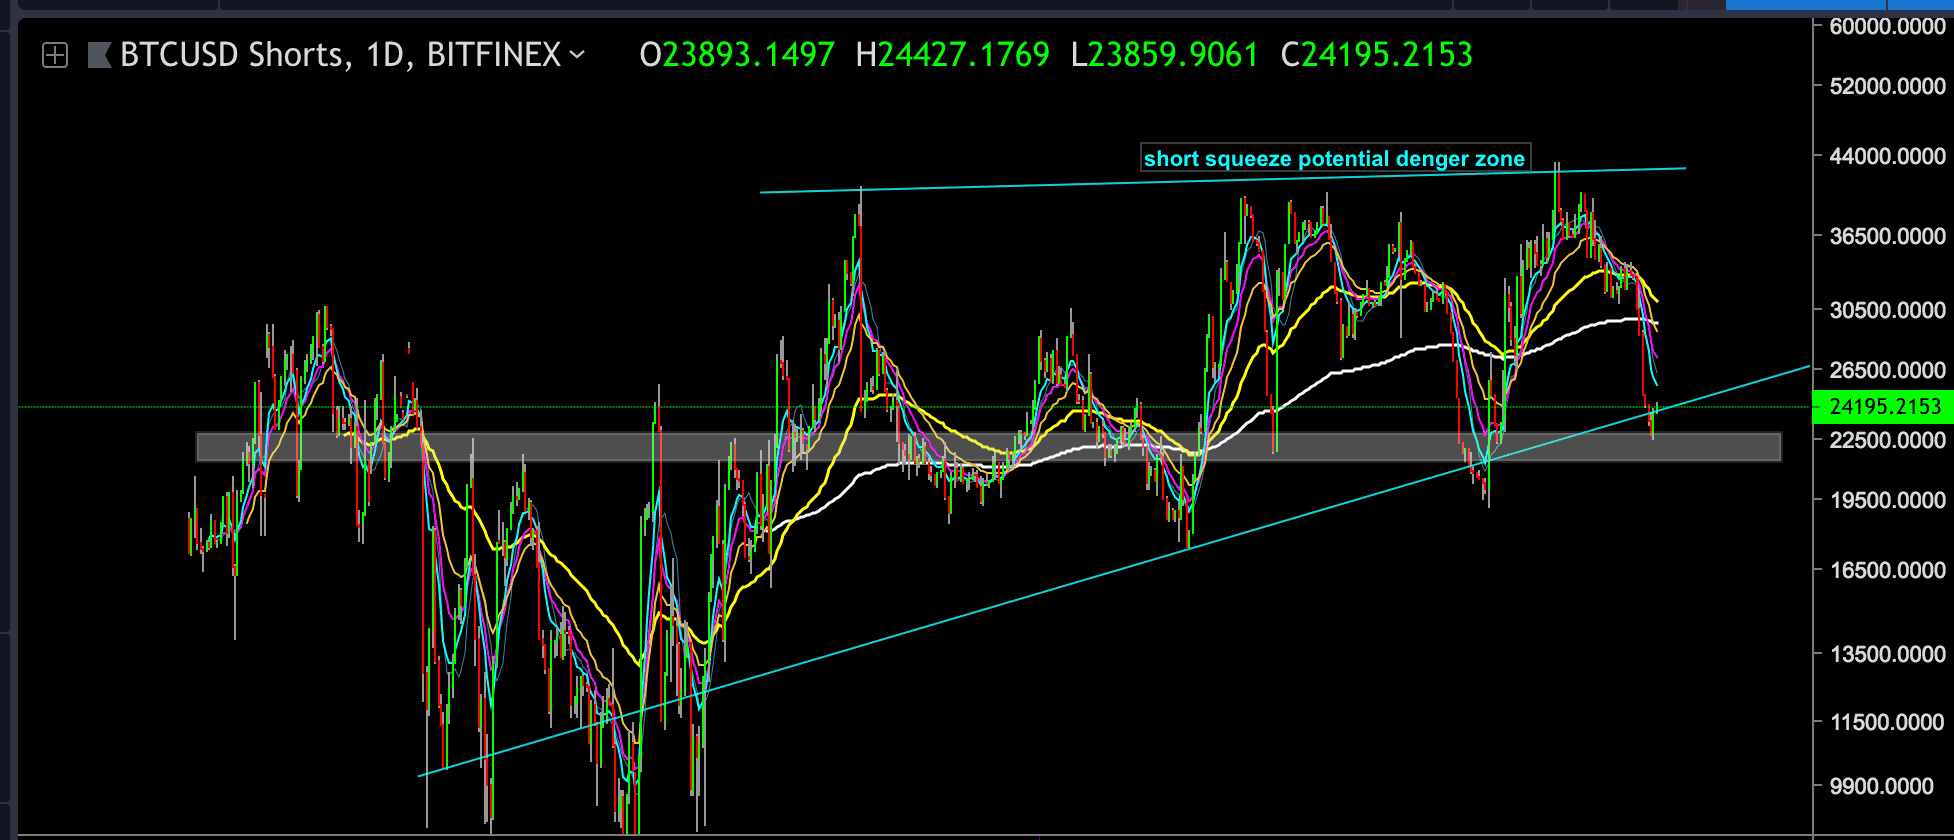
It is always important to follow the BTCUSD shorts VS BTCUSD Longs charts (attached bellow). Looking at the shorts/long charts can assist in understanding the market’s current situation. We can notice that the amount of short opened positions declined to a very low level of 23,000 which acted as a support level (marked on the attached chart), while the long opened positions chart went up in the sky toward the resistance level.
Whenever the Short/Long opened positions chart gets to a critic value it is a good signal that a big move will probably take place. Bulls are squeezing the Bears or in our case Bears liquidating the Bulls. There were too many long positions open for BTCUSD, and the bears just slammed the price below the longs stop loss common area to close their position.
The BTC free fall affected the all market immediately, as it is the market’s leader.
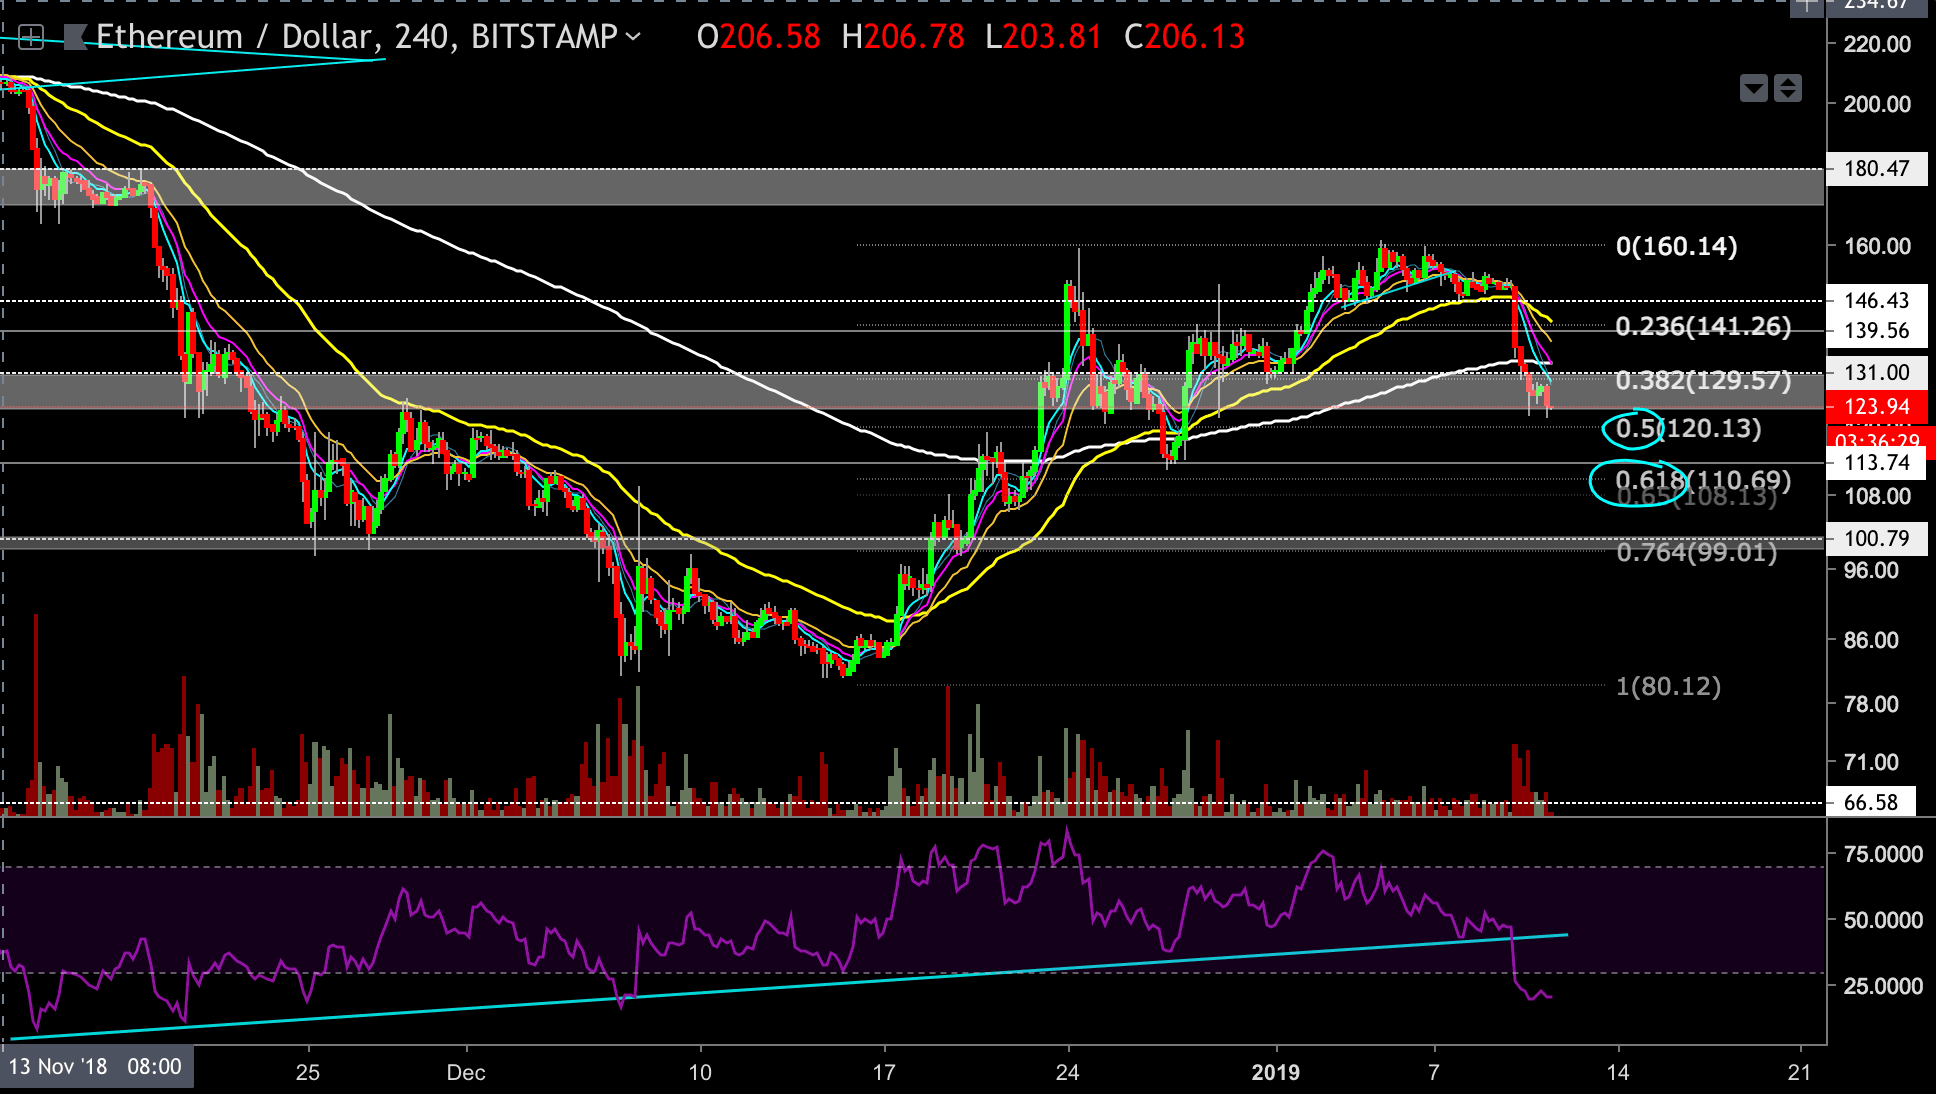
Ethereum like all the other big Altcoins reacted the same with a 17% drop and is currently trading at the $127 price level.
In our previous analysis, we alerted that if the bulls wouldn’t find the strength to breach the $160 resistance level, then ETH is likely to retest the support level of $146 or lower support of $131-$124. And without any coincidence, ETH falls exactly to the $131 support level held there for few hours and did another leg down toward the $124 level.
So what’s now…?
Looking at The 4-Hour ETH-USD Chart (Bitstamp)
BTCUSD Shorts and Longs Charts (Bitfinex)


Article comments