Ethereum [ETH] Technical Analysis: Long-term price movement to side the bull
![Ethereum [ETH] Technical Analysis: Long-term price movement to side the bull](https://coinhub.news/img/e2/e2954b1211f2af29e61ef768a7487009_730_522.webp)
Ethereum [ETH] has welcomed the new year with open arms and has climbed one step up on the top-10 cryptocurrencies ladder. Ethereum, which was settled on the number third position, on January 2, climbed up to become the second-largest cryptocurrency in the world.
At the time of press, the coin was valued at $154.33, with a market cap of $16 billion. The coin registered a 24-hour trade volume of $3 billion, with a growth of 8.35% over the past 24 hours. The coin has been doing well since past few days, making its overall hike 21.30% over seven days. The coin is still growing gradually as it reports a rise of 0.36% over the past hour.
1-hour
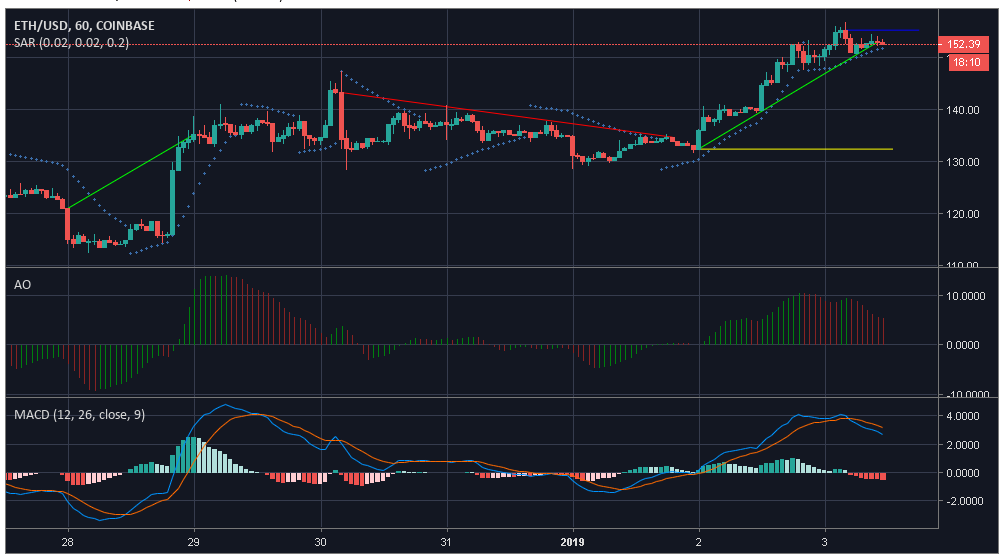
Ethereum’s one-hour chart indicates an uptrend from $120.94 to $135.15 after which it dropped. The downtrend was marked from $134.64 to $143.22. The coin, however, managed to change the trend into a growing one. The coin reported an uptrend from $132.34 to $152.85. The coin was restricted with immediate resistance at $155.20 whereas, support was provided at $132.34.
Parabolic SAR points towards a bullish market, as the markers have aligned under the candles.
Awesome Oscillator points to a weakening bearish momentum.
MACD line is under the signal line, after a bearish crossover, indicating a bear market.
1-day
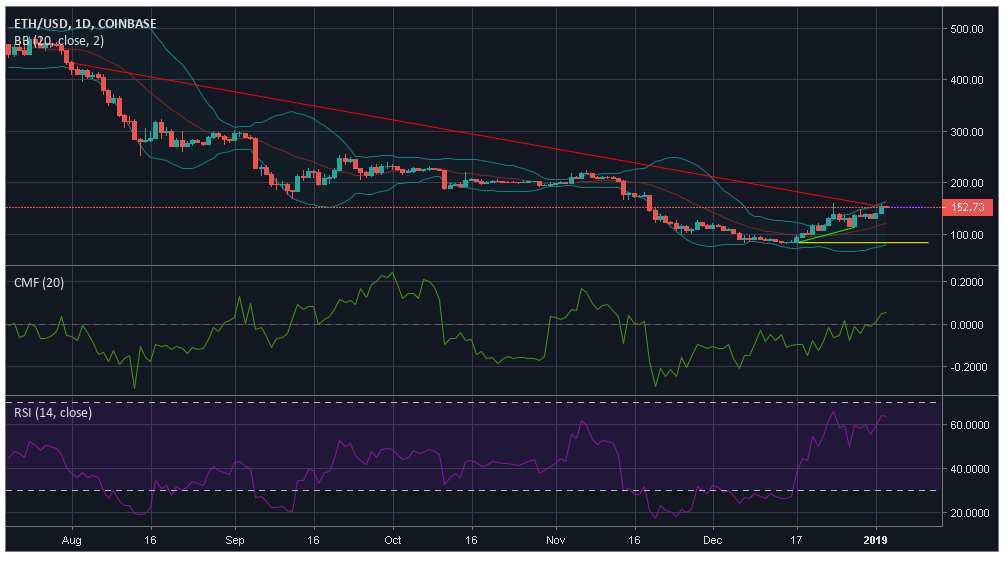
The one-day chart of the coin reports a massive downtrend from $432.36 to $153.50. The coin reported a miniscual uptrend from $83.51 to $113.31 and was restricted at $153.50. While the coin was offered support at $83.51.
Bollinger Bands appear to be converged, indicating reduced volatility in the market. The moving average line is under the candlesticks marking a bullish market.
Chaikin Money Flow is above zero, pointing towards a bullish ride for the cryptocurrency.
Relative Strength Index indicates that the buying and selling pressures are evening each other out.
Conclusion
As per the indicators Parabolic SAR, Bollinger Bands and Chaikin Money Flow a bullish market is predicted to be reigning. However, according to Awesome Oscillator and MACD, bear seems to have laid a trap and might overtake the market.


Article comments