Ripple Price Analysis: XRP/USD’s Breakdown Looks Real
Ripple price nosedived recently and broke the $0.4265 support against the US Dollar. XRP/USD breakdown below $0.3750 looks real and it could ignite more losses.
Key Talking Points
Ripple Price Forecast
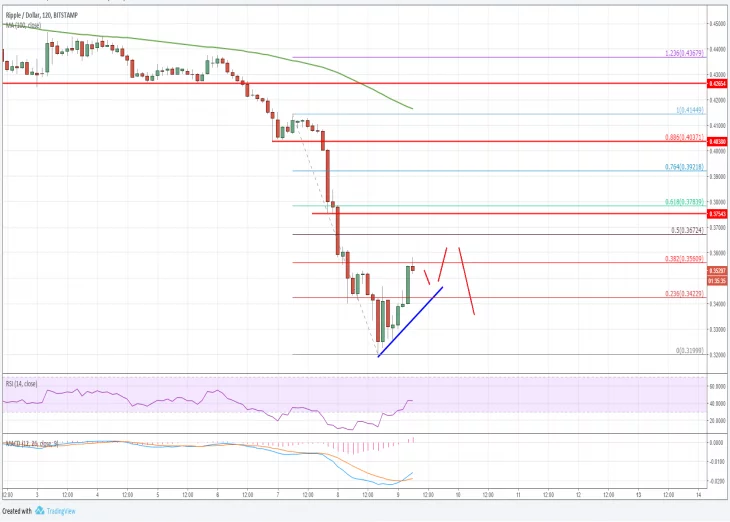
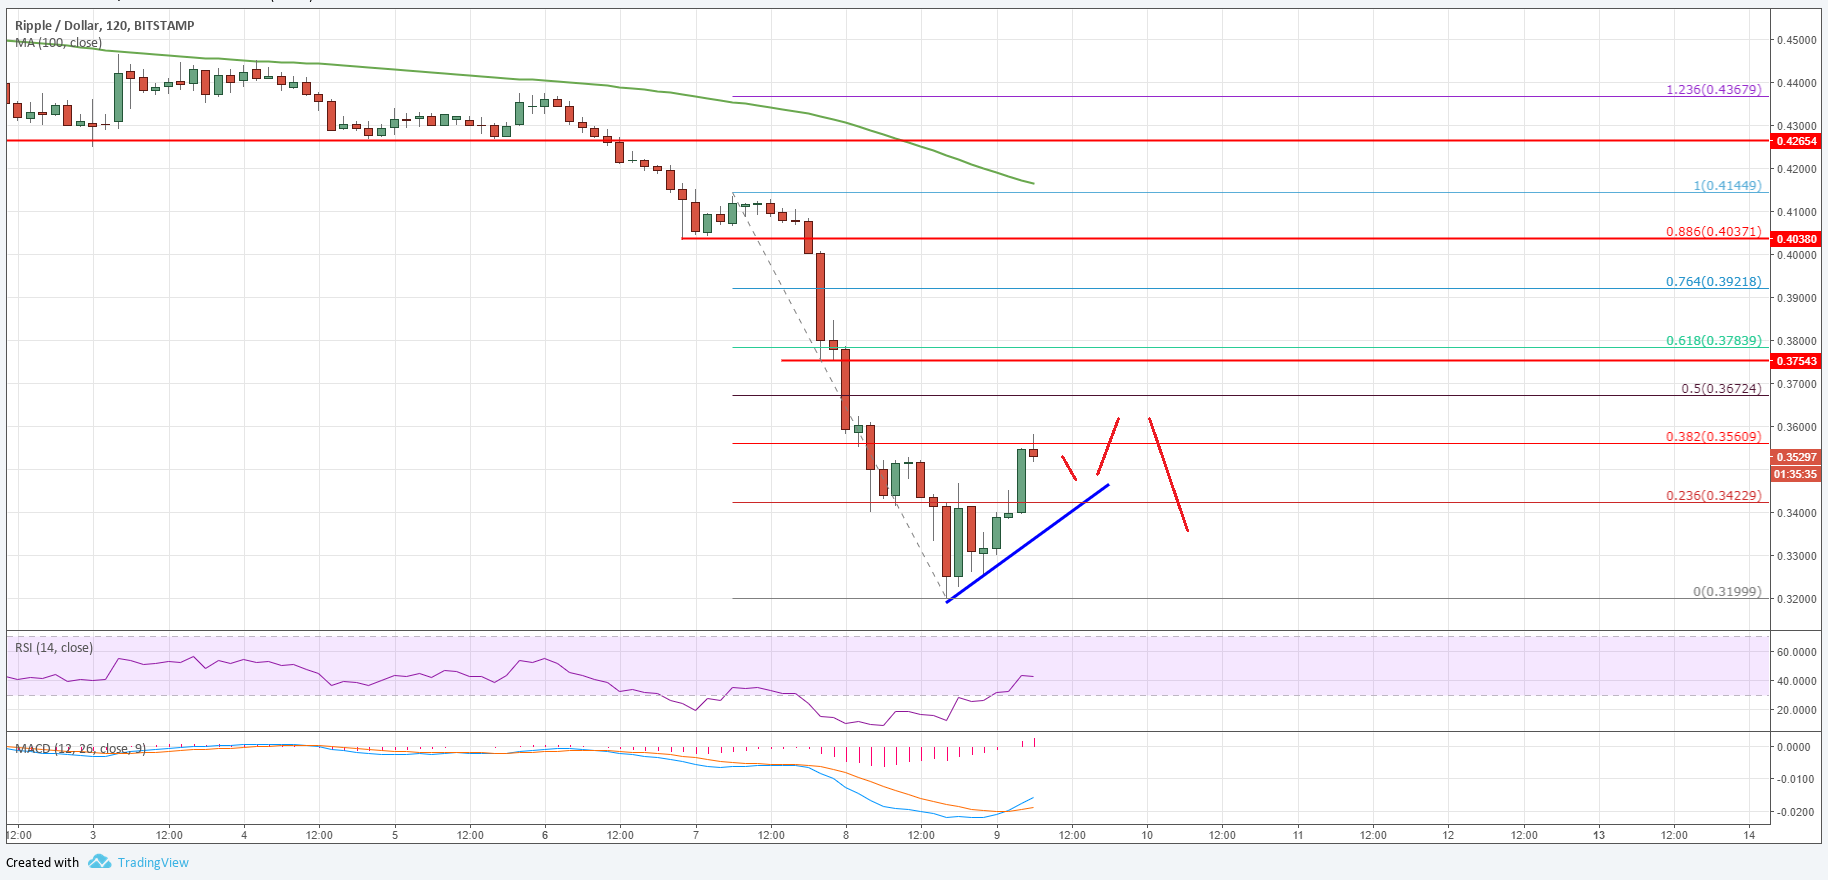
In the last analysis, we discussed a crucial support near $0.4265 in Ripple price against the US Dollar. The XRP/USD pair broke the stated support and tumbled below the $0.4000 and $0.3750 supports.
Looking at the chart, the price even broke the $0.3400 support and traded towards the $0.3180 level. A low was formed at $0.3199 and the price is currently correcting higher. It already moves past the 23.6% Fib retracement level of the last decline from the $0.4144 high to $0.3199 low.
Additionally, there is a tiny connecting bullish trend line formed with support at $0.3430 on the 2-hours chart of the XRP/USD pair. As long as the price is above the trend line and $0.3400, it could continue to correct higher.
However, gains could be contained near the $0.3620 and $0.3672 levels. An immediate resistance is the 38.2% Fib retracement level of the last decline from the $0.4144 high to $0.3199 low at $0.3560.
On the flip side, if the price breaks the trend line and $0.3400, it could resume its bearish move below the $0.3300 level. More importantly, if sellers gain traction, there are chances of more losses below the $0.3199 low.
Overall, ripple price breakdown below $0.3750 looks real and it remains at a risk of more declines. There could be short term recoveries, which are likely to face hurdles near the $0.3620 and $0.3672 levels. The most important resistance sits near $0.3750, which is the 61.8% Fib retracement level.
The market data is provided by TradingView.


Article comments