Ethereum’s Price and Network Activity Diverge
Ethereum’s price usually follows network usage in a fairly significant correlation in line with MetCalfe’s Law, but recently that hasn’t quite been the case.
Ethereum’s daily transaction numbers, for example, although they have fallen slightly, they have stayed somewhat stable at around 600,000, not falling below 500,000 during normal network usage.
Ethereum’s price at these transaction numbers was about $400-$500 in April and around same level in November, yet the current price is at $192 at the time of writing.
![]()
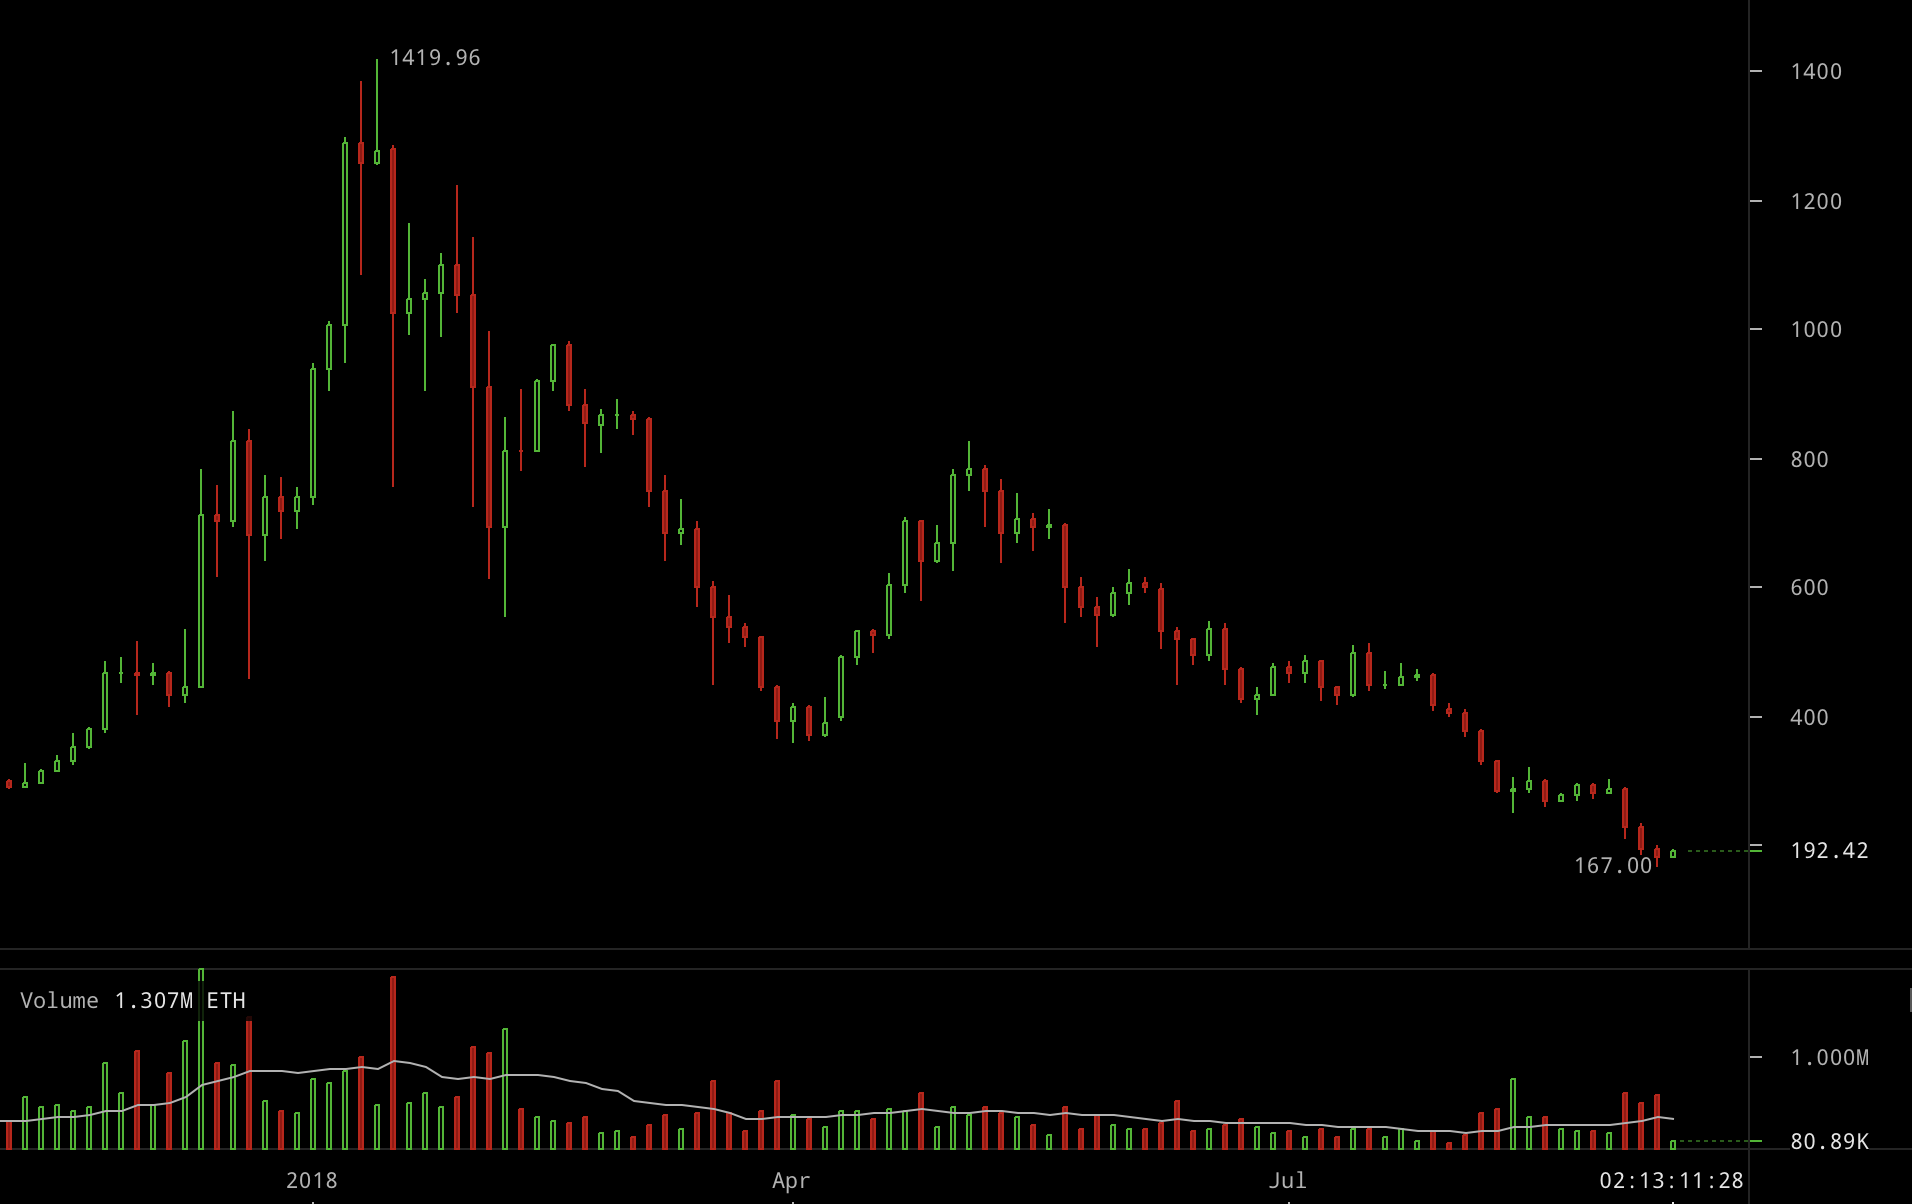
As can be seen, ethereum’s price kept falling and falling while network usage keeps somewhat steady except for a brief bleep in July when the network was at over capacity.
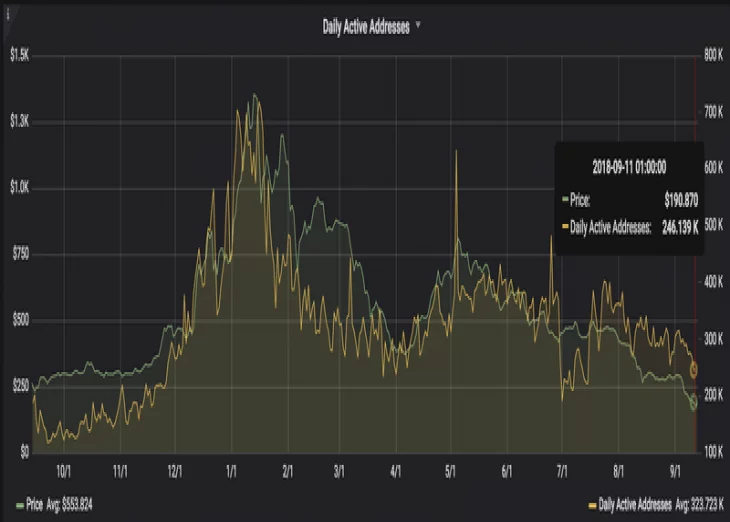
Another indicator may be active addresses. According to data from Santiment, they too have remained somewhat steady, albeit slightly falling recently, while price hasn’t.
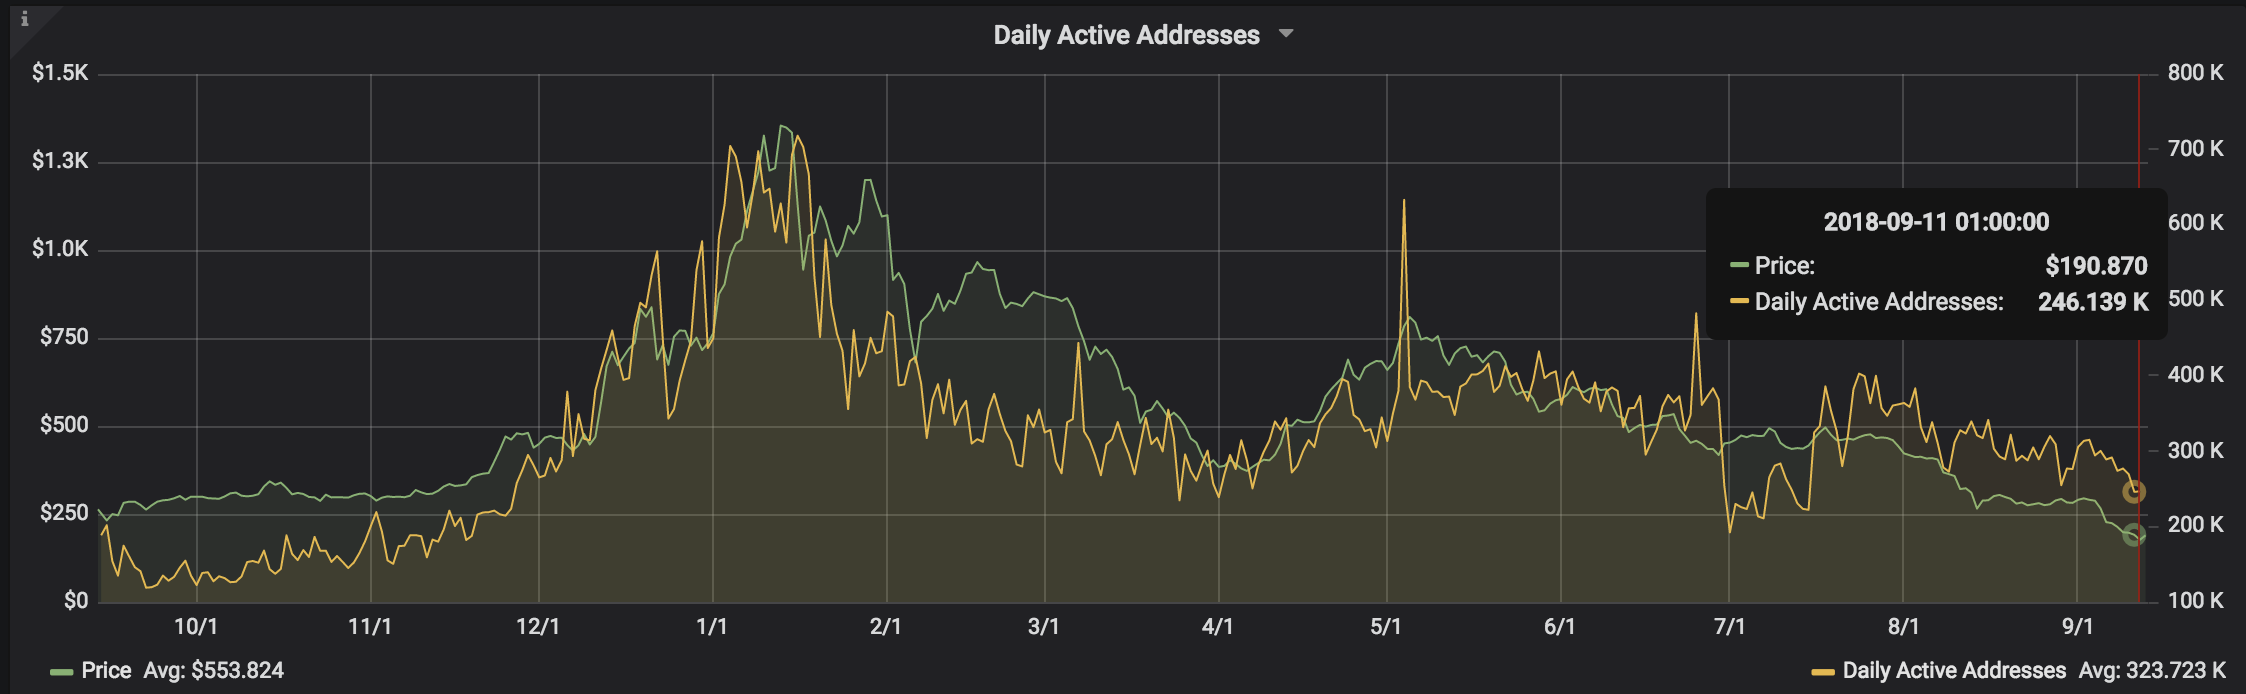
Price was above network activity for much of the year according to the above chart, but since circa mid-July price has fallen and has remained below active usage.
The reason for the correlation in ordinary circumstances is somewhat logical in that the more people use eth then the more people have to first become owners of eth meaning the more demand for eth.
Yet recently sentiment may have overshot with one data point being very revealing. Santiment tracks a number of exchanges and has a graph which shows how much eth was deposited and how much eth was withdrawn. Below is the difference:
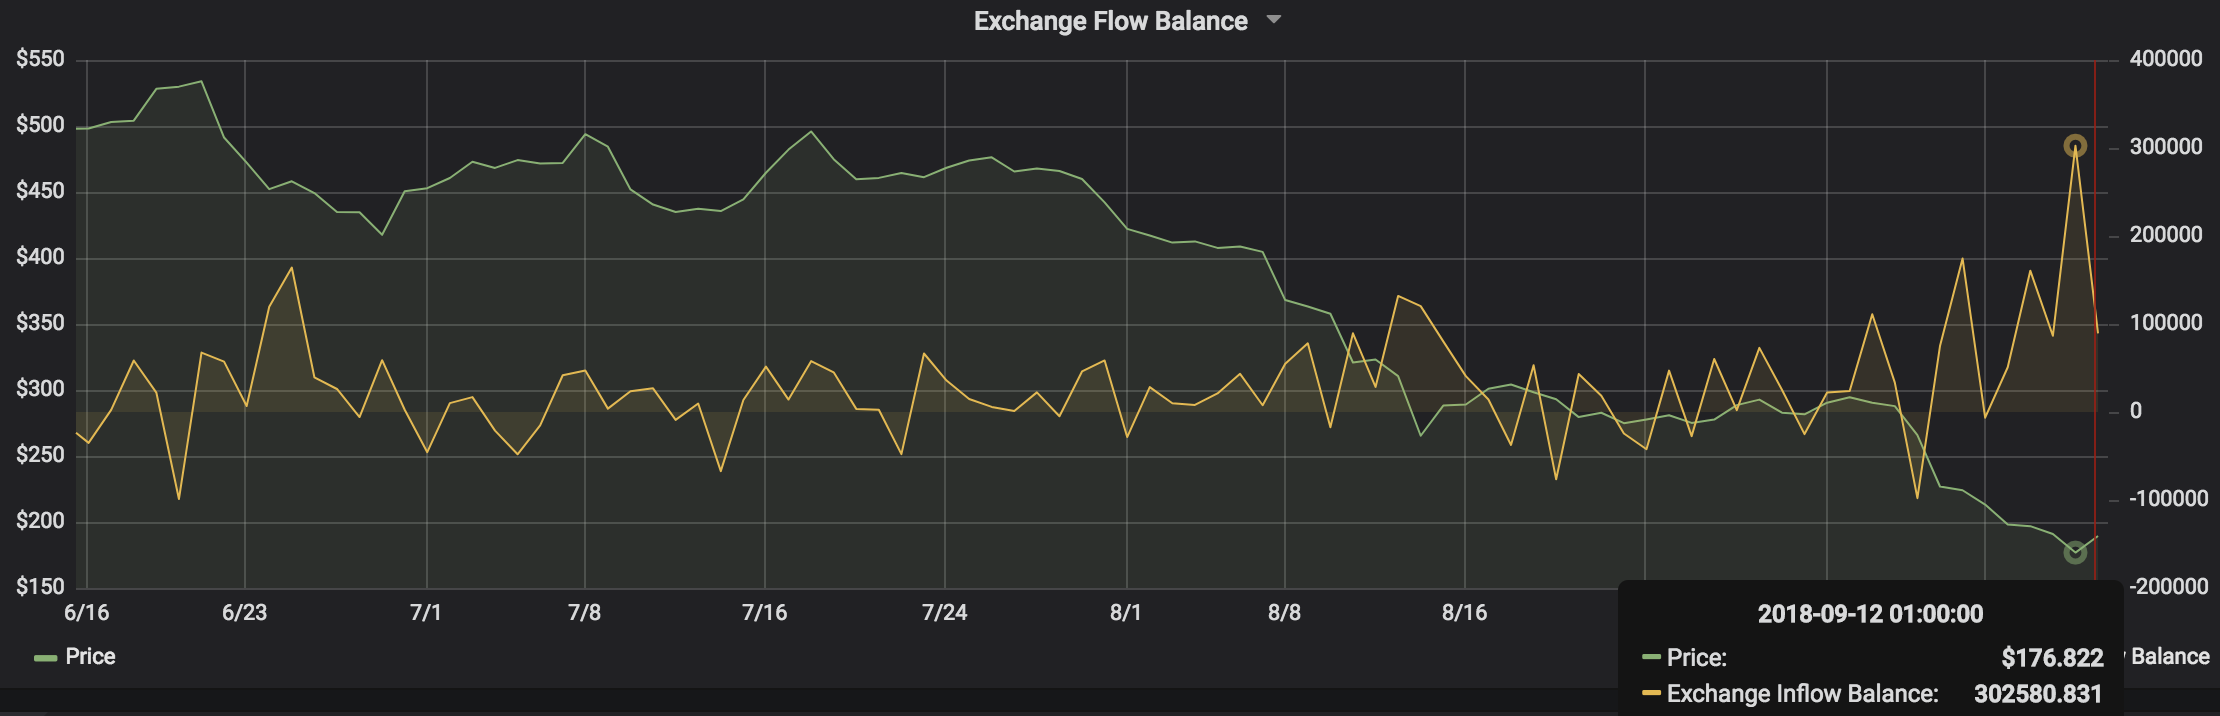
This shows that since September the 6th, some ◊930,000 more eth has been sent to exchanges than withdrawn. The only day when there were more withdrawals was on September the 8th and even then just ◊6,400 more eth was withdrawn than deposited.
The assumption here is of course that if more eth is being sent to exchanges than withdrawn, then far more is being sold than bought and sent off to a hardware wallet.
That assumption might not fully hold, but one million eth sold since September the 6th does sound a reasonable estimate.
That considerable and uncharacteristic sell pressure may have contributed to the divergence between price and network activity as sentiment perhaps got slightly detached from reality.
Copyrights Trustnodes.com


Article comments